Figures & data
Table 1 Physical characteristics, ultrasonography measurements, and muscle strength of the participants (n = 184)
Figure 1 Typical examples of the high (left) and low (right) echo intensity of the rectus femoris muscle.
Note: The value of EI, defined as the mean pixel intensity in the muscle, was determined by gray scale analysis.
Abbreviations: EI, echo intensity; FT, subcutaneous fat thickness; MT, muscle thickness; RF, rectus femoris muscle; VI, vastus intermedius muscle.
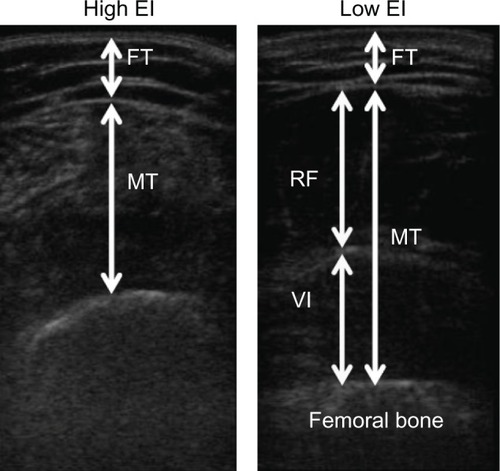
Figure 2 Association between the EI value and isometric knee extension strength in all participants (n = 184).
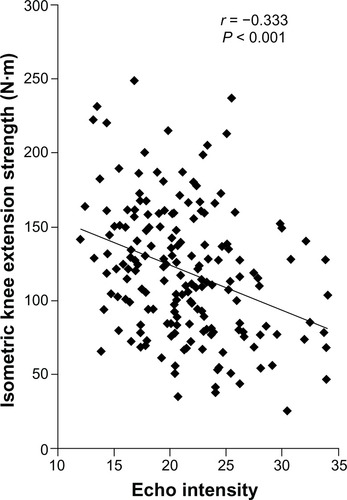
Table 2 Correlation coefficients between MT, EI, physical characteristics, and muscle strength of the participants (n = 184)
Table 3 Association of EI and MT with muscle strength using multiple regression analysis (n = 184)
Table 4 Partial correlation coefficients between MT, EI, and muscle strength, with age, height, weight, and FT as control variables (n = 184)