Figures & data
Table 1 Characteristics and number of elderly in each exercise training group
Figure 1 Two dimensional moment signal which contains steady standing phases.
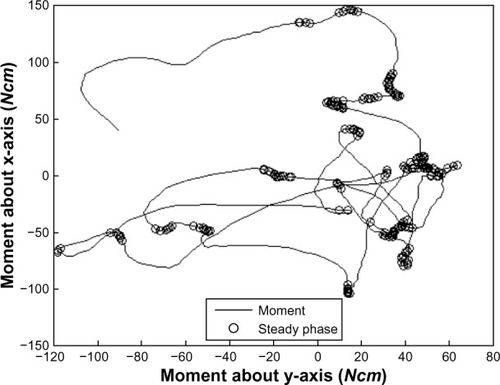
Figure 2 Local variation of weight signal provides a measure for quiet and active phases in maintaining posture.
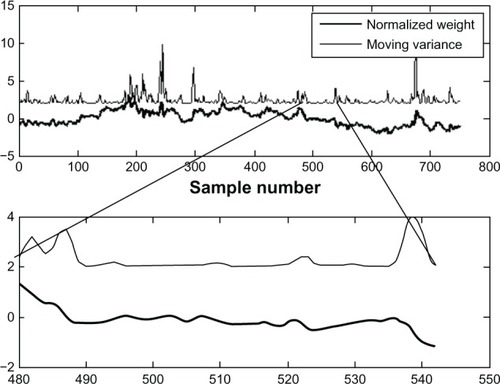
Table 2 Posturography measurements at 3 months from training in the muscle force, self-administered, and balance training groups
Table 3 Falls measured during 3 years of follow-up among participants in the muscle force, self-administered, and balance training groups
Figure 3 Observed falls in different training groups (mean value and standard error of the mean are shown).
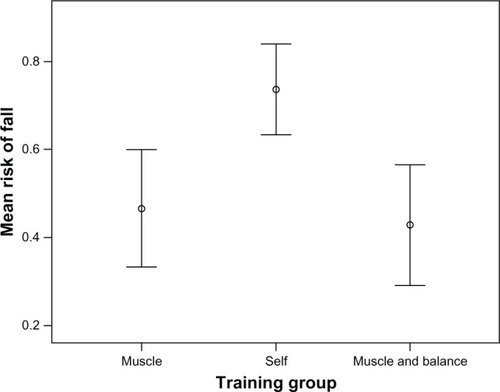
Table 4 General HRQoL in different training groups and at different time points
Figure 4 15D quality of life scores before, immediately after cessation of training, and 6 months from the baseline measurements (mean and 95% confidence intervals are shown).
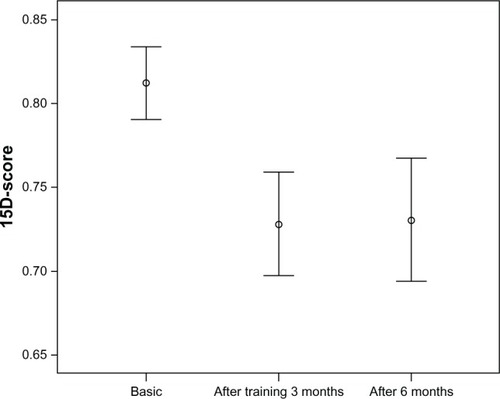
Figure 5 Usual activities (left) and vitality (right) based on 15D scores in the beginning, immediately after cessation of the training, and after 6 months from baseline measurements (mean and 95% confidence intervals are shown).
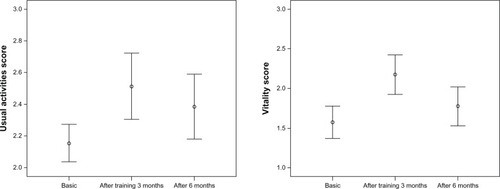
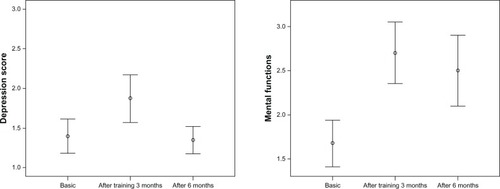
Figure 6 Depression score (left) and mental function score (right) derived from 15D QoL (quality of life) at the beginning of training, immediately after training, and 6 months after commencing the training (mean and 95% confidence levels are shown).