Figures & data
Table 1 Comparison of general information and clinical features between patients in different groups
Table 2 Predicting obstruction in elderly population using ROC curves and currently adopted cutoff values for different TEG indices
Table 3 Predicting obstruction in elderly population using ROC curves and optimal cutoff values for different TEG indices
Figure 1 Receiver-operating characteristics (ROC) curve of joint index and obstruction occurrence.
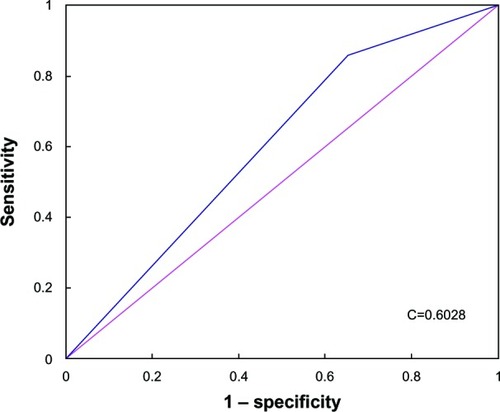
Table 4 Predicting hemorrhage in elderly population using ROC curves and currently adopted cutoff values for different TEG indices
Table 5 Predicting hemorrhage in elderly population using ROC curves and optimal cutoff values for different TEG indices
Figure 2 Receiver-operating characteristics (ROC) curve of joint index and hemorrhage occurrence.
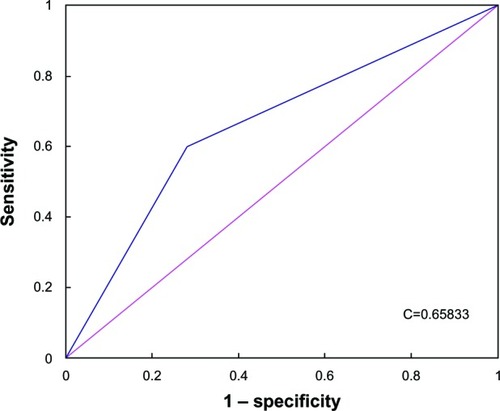
Table 6 Multi-factor Cox regression analysis on predicting obstruction occurrence
Table 7 Multi-factor Cox regression analysis on predicting hemorrhage occurrence