Figures & data
Table 1 Description of mini-campaigns
Table 2 LIFE campaign: Stride for LIFE
Table 3 LIFE Study baseline characteristics
Table 4 Barriers/facilitators to self-regulation (%)
Table 5 Patterns of activity during center-based exercise by sex
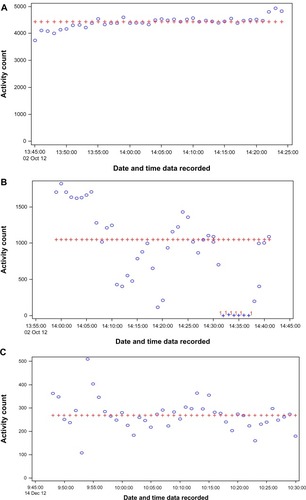
Figure 1 Panels (A–C) represent three representative accelerometry recordings from center-based exercise training.
Notes: In (A–C), the y-axis represents counts/minute, whereas the x-axis is the minute-by-minute time course for the training bout. The horizontal red “+” marks represent the median counts/minute achieved across the activity session; the blue circles represent the counts achieved for a given minute of activity; the horizontal blue “+” marks indicate rest periods and identify the number of the rest period with a numeric superscript, if any rest intervals were taken. The participant in is exercising well above the standard adult cutoff point for moderate-intensity exercise (2,690 counts/minuteCitation21) and has a very consistent pace across the entire exercise bout. The participants in have median activity counts well below the adult cutoff point for moderate PA with the individual in being the most compromised. Note that the person in exhibits a high degree of variability in intensity and had to take a 6-min rest stop. Such patterns are common for participants with joint pain or various chronic health conditions.