Figures & data
Table 1 Composition of each supplement (per daily dose)
Figure 1 Channel positions for near-infrared spectroscopy. Changes in oxyhemoglobin concentration were measured at 24 sites in the bilateral frontal areas of the brain. Filled (black) circles and open (white) circles show the emitter and detector probes, respectively. The numbers show the location of the measured channels.
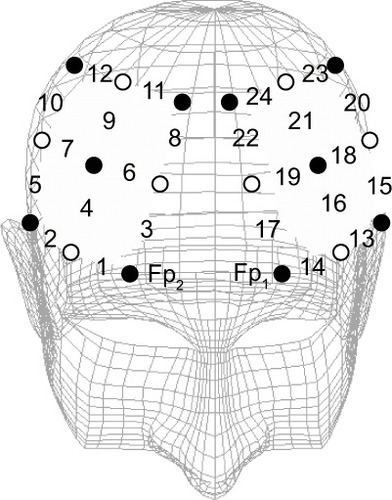
Table 2 Baseline characteristics of the participants
Figure 2 Flow chart of participation throughout the study.
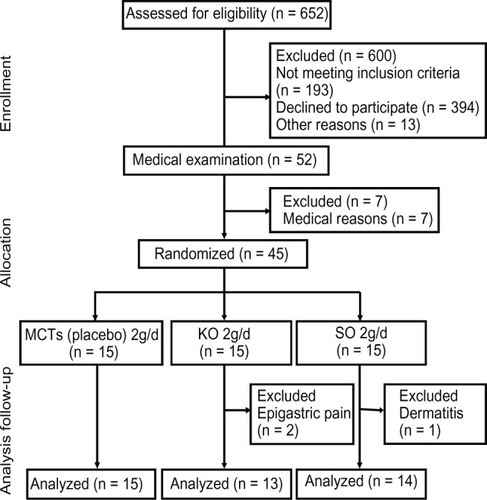
Table 3 Polyunsaturated fatty acids in plasma
Figure 3 Topographic maps of changes in oxyhemoglobin concentration at 225.0 seconds during working memory task.
Note: MCT, n = 15; KO, n = 13; SO, n = 14.
Abbreviations: MCT, medium-chain triglyceride; KO, krill oil; SO, sardine oil.
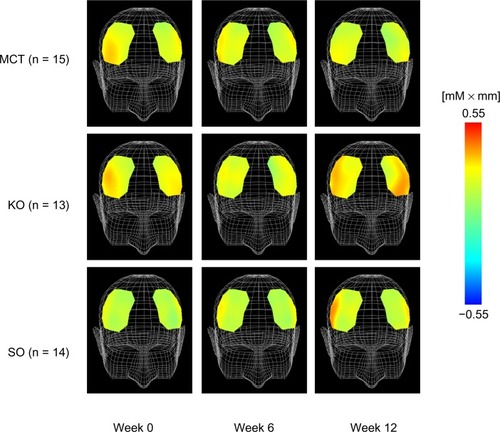
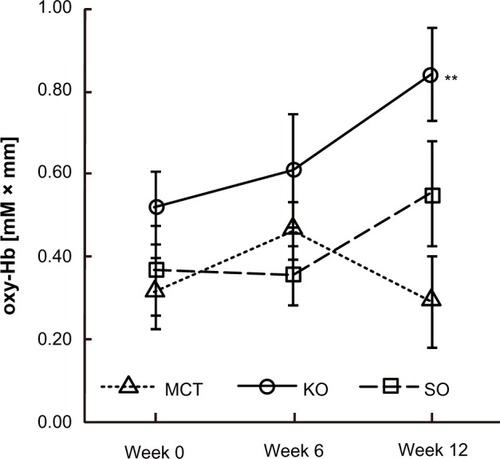
Figure 4 Comparison of changes in oxyhemoglobin (oxy-Hb) concentrations at channel 10 during working memory task.
Abbreviations: MCT, medium-chain triglyceride; KO, krill oil; SO, sardine oil.
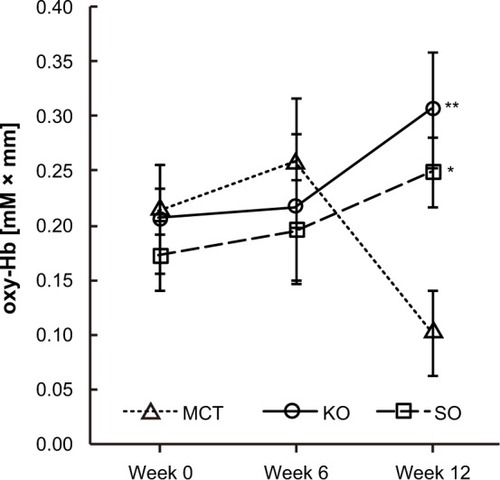
Figure 5 Comparison of differential values in P300 latencies and amplitudes during the working memory task. (A) Latency at Cz, (B) latency at Pz, (C) amplitude at Cz, and (D) amplitude at Pz.
Abbreviations: MCT, medium-chain triglyceride; KO, krill oil; SO, sardine oil.
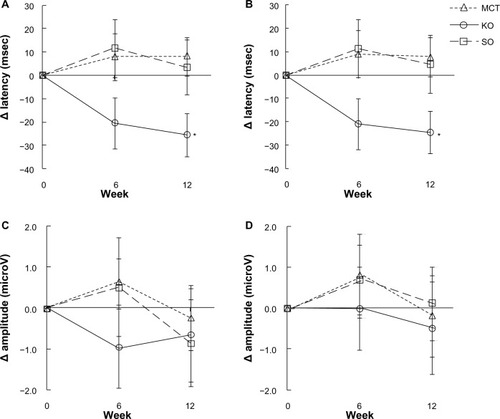
Figure 6 Topographic maps of changes in oxyhemoglobin concentration at 150.0 seconds during the calculation task.
Note: MCT, n = 15; KO, n = 13; SO, n = 14.
Abbreviations: MCT, medium-chain triglyceride; KO, krill oil; SO, sardine oil.
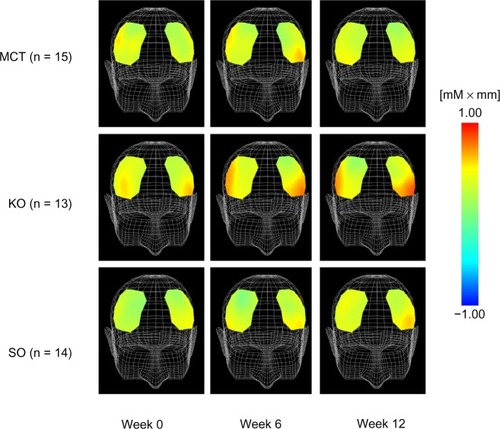
Figure 7 Comparison of changes in oxyhemoglobin (oxy-hb) concentration at channel 15 during the calculation task.
Abbreviations: MCT, medium-chain triglyceride; KO, krill oil; SO, sardine oil.