Figures & data
Table 1 Baseline characteristics of 12,650 adults over 60 who underwent coronary artery bypass grafting, percutaneous coronary interventions or both
Table 2 Odds of CABG or PCI, by ERA score and demographic predictors, in 12,650 patients over 60
Figure 1 Receiver operator curve for Elder Risk Assessment Score with the outcome of coronary artery bypass graft or percutaneous coronary intervention.
Abbreviations: AUC, area under the curve; CI, confidence interval.
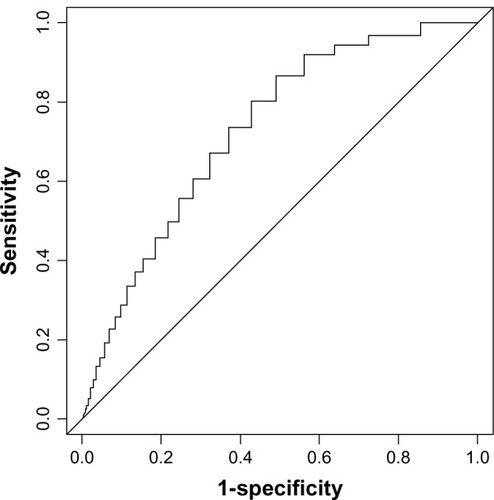
Table 3 Hazard ratios for overall mortality in 902 patients who underwent coronary artery bypass or percutaneous coronary intervention, by ERA score
Table 4 Hazard ratios for overall mortality for all 12,650 primary care patients, by ERA score with added coronary revascularization term
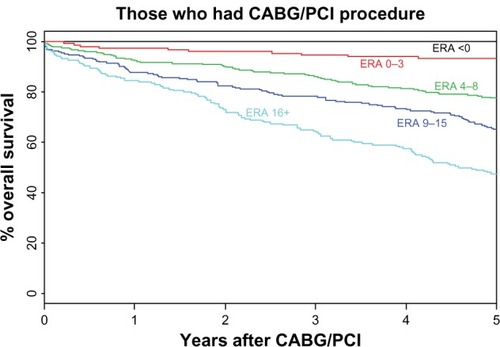
Figure 2 Time to mortality for 902 patients who underwent coronary artery bypass graft and percutaneous coronary intervention, according to ERA score.
Abbreviations: CABG; coronary artery bypass graft; ERA, Elder Risk Assessment; PCI, percutaneous coronary intervention.