Figures & data
Table 1 Characteristics of patients with Methicillin-resistant Staphylococcus aureus pneumonia in this study
Table 2 Vancomycin pharmacokinetic/pharmacodynamic parameters between severe hypoalbuminemia and non-severe hypoalbuminemia patients with methicillin-resistant Staphylococcus aureus pneumonia
Figure 1 Twenty-eight-day mortality according to stratification of the vancomycin AUC/MIC values in severe hypoalbuminemia and non-severe hypoalbuminemia groups. (A) AUC/MIC <250 μg × h/ml, (B) AUC/MIC = 250–450 μg × h/ml, and (C) AUC/MIC >450 μg × h/ml. P-values were determined using χ2 tests. The AUC values of 250–450 and >450 μg × h/mL were significantly associated with 28-day mortality in patients with severe hypoalbuminemia (**P < 0.001), while AUC values of <250 μg × h/ml were not (P = 0.143).
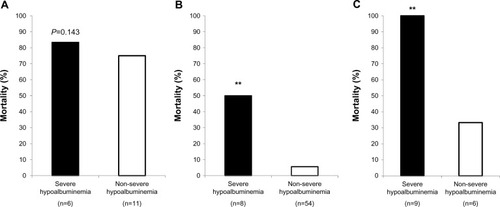
Table 3 Adverse effects of vancomycin between severe hypoalbuminemia and non-severe hypoalbuminemia patients
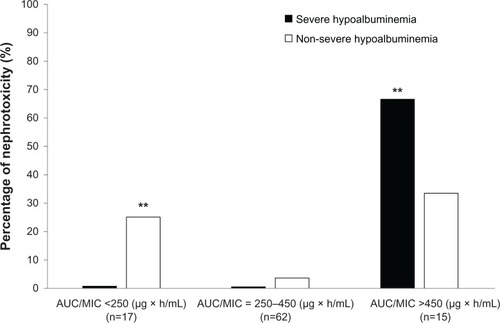
Figure 2 Percentage of nephrotoxicity after VCM administration in the severe hypoalbuminemia and non-severe hypoalbuminemia groups.
Abbreviations: AUC, area under the concentration curve; MIC, minimum inhibitory concentration; VCM, vancomycin.