Figures & data
Figure 1 Flow chart.
Abbreviations: BMI, body mass index; BMD, bone mineral density; SD, standard deviation; WB-EMS, whole-body electromyostimulation; WC, waist circumference.
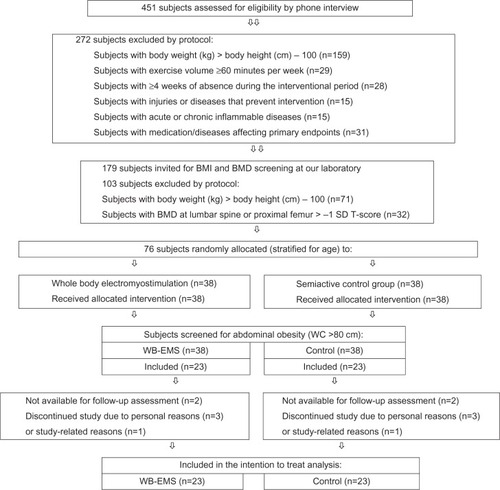
Table 1 Baseline characteristics of the WB-EMS and control groups
Figure 2 Whole-body electromyostimulation electrodes (vest and sleeves).
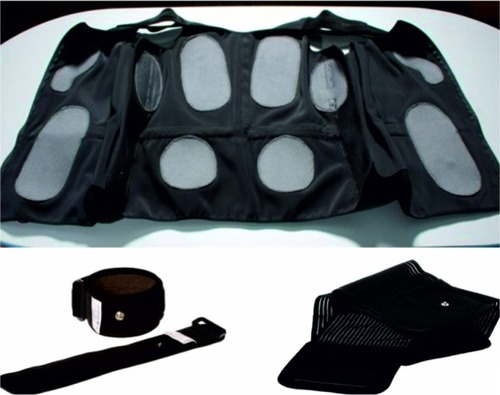
Figure 3 Whole-body electromyostimulation exercise protocol.
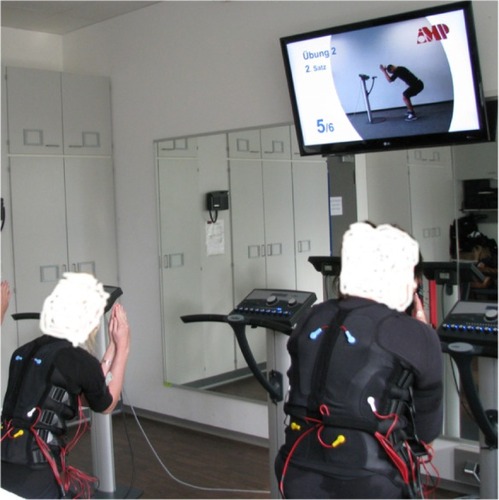
Table 2 Baseline and follow-up data, absolute changes, and statistical parameters of primary endpoints in the WB-EMS and control groups
Table 3 Changes in body fat and maximum isometric strength in the WB-EMS and control groups