Figures & data
Table 1 Main characteristics of the different laser techniques
Table 2 Baseline characteristics of patients in the three groups
Table 3 Intraoperative, early, and late postoperative complications and outcomes in patients in the three groups
Figure 1 Logistic regression analysis for three types of laser prostatectomy: predicted (A) post-void residual urine volume, (B) peak-flow rate (PFR), and (C) prostate-specific antigen (PSA) level curves.
Note: A significant improvement was observed in terms of post-voiding residual urine volume, peak-flow rate, and PSA level, compared with preoperative levels (P<0.05).
Abbreviations: M, months; OP, operation; PVP, photoselective vaporization of prostate; RU, residual urine; SE, standard error.
Abbreviations: M, months; OP, operation; PVP, photoselective vaporization of prostate; RU, residual urine; SE, standard error.
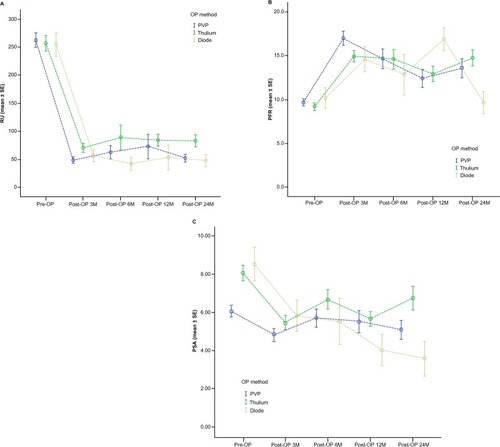
Table 4 Logistic regression analysis to predict overall morbidities of laser prostatectomy