Figures & data
Table 1 Demographic characteristics of older and younger PLWHA
Figure 1 The proportion of PLWHA aged 50 years and above in the total and heterosexual HIV/AIDS populations.
Abbreviations: AIDS, acquired immunodeficiency syndrome; HIV, human immunodeficiency virus; PLWHA, people living with HIV/AIDS.
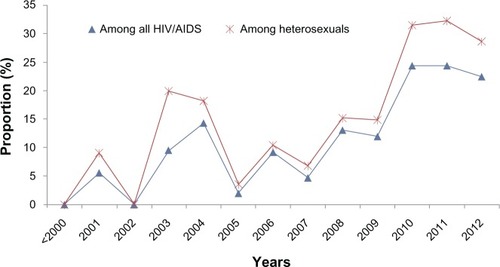
Table 2 Epidemiological characteristics of older and younger PLWHA
Table 3 Factors associated with death in older and younger PLWHA
Figure 2 Analysis of the cause of death in older and younger PLWHA.
Abbreviations: AIDS, acquired immunodeficiency syndrome; HIV, human immunodeficiency virus; PLWHA, people living with HIV/AIDS.
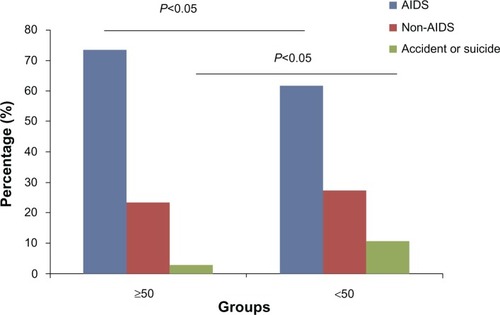
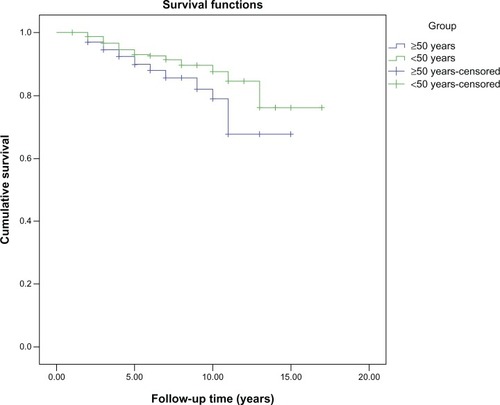
Figure 3 Survival analysis of PLWHA above and below the age of 50 years.
Abbreviation: PLWHA, people living with human immunodeficiency virus/acquired immunodeficiency syndrome.