Figures & data
Table 1 Comparative values of plasma glucose and lipid fractions between the two medical assessments
Figure 1 Evolution of glucose and lipid-fraction concentrations between the two assessments.
Note:
P-values calculated using the Mann–Whitney U test (difference between medians).
Abbreviations: HDL, high-density lipid; LDL, low-density lipid.
Abbreviations: HDL, high-density lipid; LDL, low-density lipid.
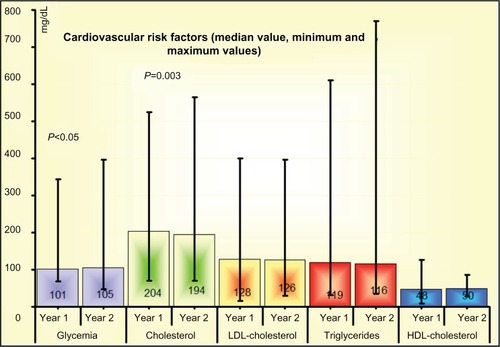
Table 2 Comparative values of cardiovascular risk factors between the two assessments and sex-related differences
Table 3 Comparative values of plasma glucose and lipid fractions between the two assessments and sex-related differences
Table 4 Evolution of ischemic heart disease and its complications