Figures & data
Figure 1 Hypothesized path model. The proposed path analysis model of the mediation effects explaining the personality traits, demographic variables, social inhibition and somatization. The lines with arrow heads show the direction of the path coefficients.
Abbreviations: Demo var, demographic variable; e1, error term of somatization; e2, error term of social inhibition.
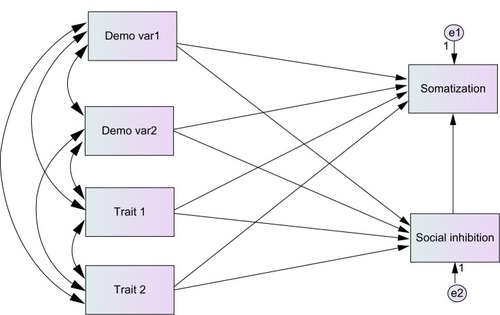
Table 1 Descriptive statistics of the sample (n=126)
Table 2 Correlation matrix between the selected personality traits and the demographic and dependent variables
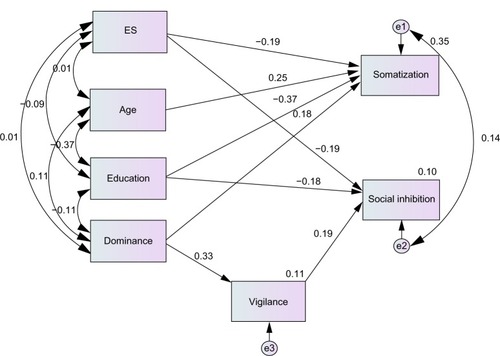
Figure 2 Path model for somatization and social inhibition with β and R2 as coefficients.
Notes: β = standardized regression coefficients which constitute the effect of one variable on another when other variables are controlled. R2 = squared multiple correlation coefficients which constitute the amount of variance the predictor variables explain in the observed variable.
Abbreviations: ES, emotional stability; e1, error terms of somatization; e2, error terms of social inhibition; e3, error terms of vigilance.
Abbreviations: ES, emotional stability; e1, error terms of somatization; e2, error terms of social inhibition; e3, error terms of vigilance.
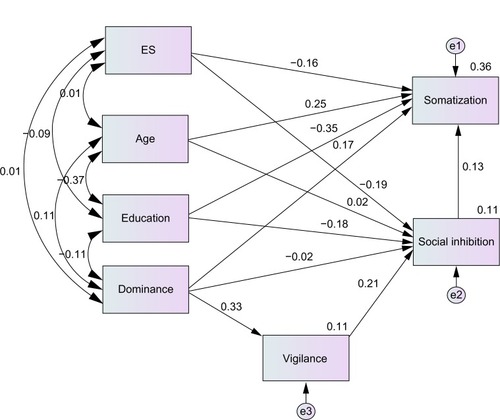
Figure 3 Path model for somatization and social inhibition with β and R2 as coefficients (final model).
Notes: β = standardized regression coefficients which constitute the effect of one variable on another when other variables are controlled. R2 = squared multiple correlation coefficients which constitute the amount of variance the predictor variables explain in the observed variable.
Abbreviations: ES, emotional stability; e1, error terms of somatization; e2, error terms of social inhibition; e3, error terms of vigilance.
Abbreviations: ES, emotional stability; e1, error terms of somatization; e2, error terms of social inhibition; e3, error terms of vigilance.