Figures & data
Table 1 Serum levels of total cholesterol and other sterols in the different age quartilesTable Footnotea
Figure 1 Correlation between serum cholesterol levels and age.
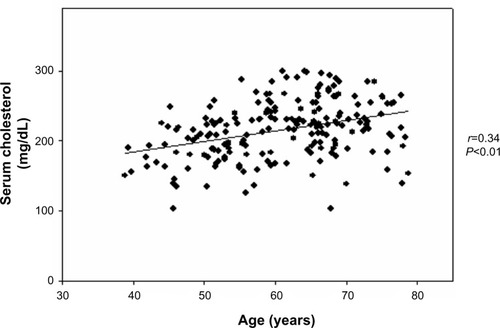
Figure 2 Correlation between serum lathosterol to cholesterol ratio, a marker of cholesterol synthesis, and age. (A) Individual data points are shown for all subjects (n=201) of the studied cohort; r=−0.32; P<0.01, linear regression analysis; (B) data points are shown for gallstone-free subjects (n=98); r=−0.48; P<0.01, linear regression analysis; (C) data points are shown for gallstone patients (n=103); r=−0.28; P<0.01, linear regression analysis.
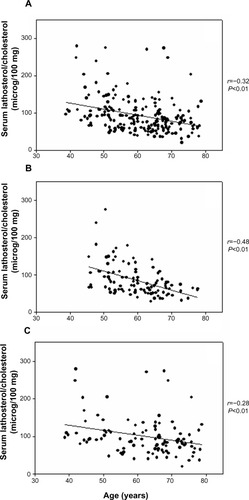
Figure 3 Correlation between serum levels of 7α-hydroxy-4-cholesten-3-one, a marker of cholesterol degradation to bile acids, and age.
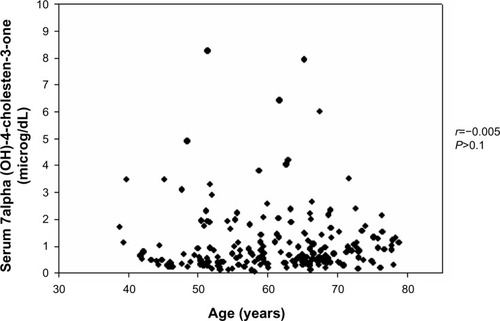
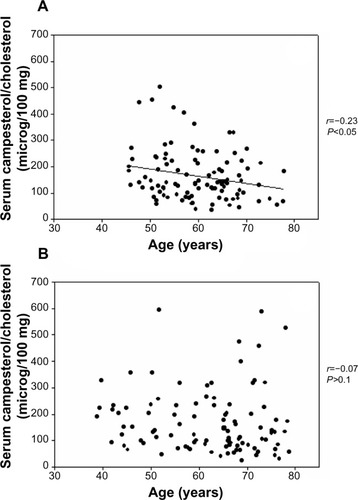
Figure 4 Correlation between serum campesterol-to-cholesterol ratio, a marker of cholesterol absorption, and age. (A) Individual data points are shown for gallstone-free subjects (n=98); r=−0.23; P<0.05, linear regression analysis; (B) data points are shown for gallstone patients (n=103); r=−0.07; P>0.1.