Figures & data
Figure 1 Flowchart of this trial.
Abbreviations: baPWV, brachial-ankle pulse wave velocity; BP, blood pressure; HR, heart rate.
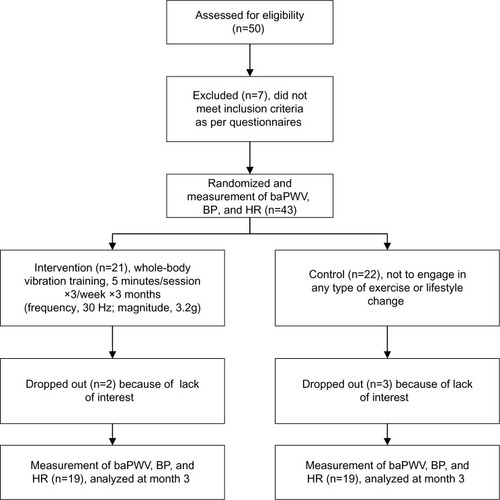
Table 1 Baseline characteristics of the sample (mean ± standard deviation)
Table 2 Comparative effects after 3 months on blood pressure and heart rate in the WBV and CON groups (mean ± standard deviation)
Table 3 Comparative effects after 3 months on baPWV in the WBV and CON groups (mean ± standard deviation)
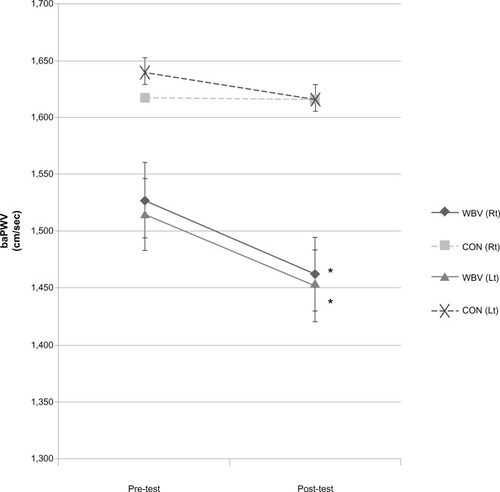
Figure 2 Bilateral brachial–ankle pulse wave velocity (baPWV) of pretest and posttest after 3 months of whole-body vibration group (WBV) and control group (CON). *P<0.05 versus pre-test.
Abbreviations: Rt, right; Lt, left.