Figures & data
Figure 1 The proposed theoretical model linking social cohesion and well-being.
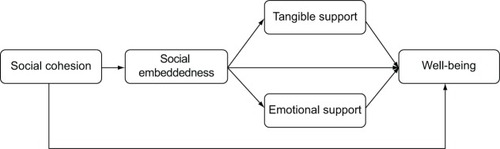
Table 1 Means, standard deviations, and zero-order correlations between study variables
Table 2 The results of SEM
Table 3 Summary of multigroup analysis
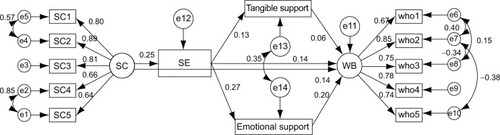
Figure 2 SEM model with standardized regression weights.
Abbreviations: SEM, structural equation modeling; SC, social cohesion; SE, social embeddedness; WB, well-being; CMIN/DF, minimum discrepancy divided by degrees of freedom; RMSEA, root mean square error of approximation; PCLOSE, p-value for test of close fit; GFI, goodness of fit index; AGFI, adjusted goodness of fit index; CFI, comparative fix index; TLI, Tucker-Lewis coefficient.
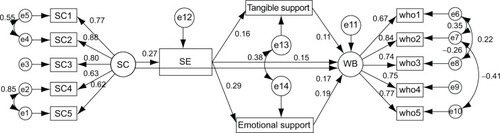
Figure 3 SEM model with standardized regression weights for male respondents.
Notes: CMIN/DF =3.548; RMSEA =0.037; PCLOSE =1.000; GFI =0.970; AGFI =0.949; CFI =0.980; TLI =0.970.
Abbreviations: SEM, structural equation modeling; SC, social cohesion; SE, social embeddedness; WB, well-being; CMIN/DF, minimum discrepancy divided by degrees of freedom; RMSEA, root mean square error of approximation; PCLOSE, p-value for test of close fit; GFI, goodness of fit index; AGFI, adjusted goodness of fit index; CFI, comparative fix index; TLI, Tucker-Lewis coefficient.
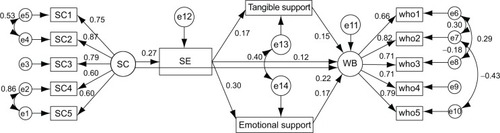
Figure 4 SEM model with standardized regression weights for female respondents.
Abbreviations: SEM, structural equation modeling; SC, social cohesion; SE, social embeddedness; WB, well-being; CMIN/DF, minimum discrepancy divided by degrees of freedom; RMSEA, root mean square error of approximation; PCLOSE, p-value for test of close fit; GFI, goodness of fit index; AGFI, adjusted goodness of fit index; CFI, comparative fix index; TLI, Tucker-Lewis coefficient.