
Figures & data
Figure 1 Chart of the participants enrolled in this study.
Abbreviations: Rt, routine test; MoCA, Montreal Cognitive Assessment; CDR, Clinical Dementia Rating Assessment; MCI, mild cognitive impairment; VD, vascular dementia; MR-DWI, magnetic resonance-diffusion weighted imaging.
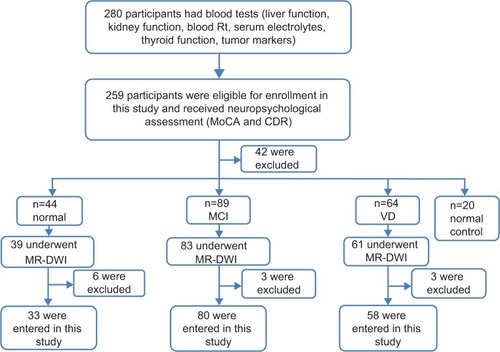
Table 1 Demographic and clinical characteristics of participants
Table 2 MoCA scores, CDR scores, and blood pressure values of the four groups
Table 3 Analysis of the MoCA and CDR scores and region-based analysis of mean ADC values in brain regions for the two hypertension stages in elderly hypertensive participants
Table 4 Mean ADC values in brain regions for the four groups
Table 5 Comparison of mean ADC values in brain regions between different groups