
Figures & data
Table 1 Characteristics of patients at baseline according to sex
Table 2 Clinical evaluation of responders/nonresponders to AChEI treatment at the 6-month follow-up
Table 3 Genotype distribution at FOXO1 locus according to the response to AChEI treatment and results from univariate and multivariate logistic regressions
Table 4 Estimated haplotype frequencies at FOXO1 locus according to the response to AChEI treatment
Figure S1 Estimated values of linkage disequilibrium coefficient r2 at FOXO1 locus according to the response to AChEI treatment.
Abbreviation: AChEI, acetylcholinesterase inhibitor.
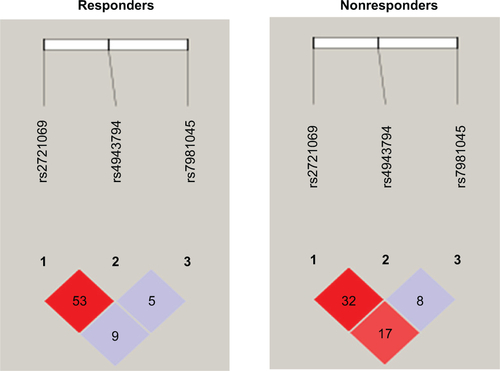
Table S1 Association of FOXO1 genotypes with the response to AChEI treatment assuming different genetic models of inheritance