Figures & data
Table 1 Demographic characteristics of the study population (N=1,889)
Table 2 Summary of cognitive functions measured in the study population (N=1,889)
Table 3 Summary of biomarker measures (N=1,889)
Table 4 Results of ANCOVA models with composite cognitive scores as the outcome variable, cholesterol Qs as independent variables stratified by homocysteineTable Footnotea
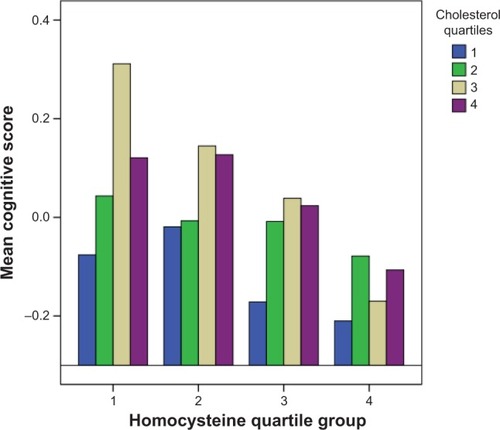
Figure 1 Predicted mean composite cognitive scores by homocysteine and cholesterol quartile groups.
Notes: Homocysteine quartile groups are divided into Q1 (≤11.81 μmol/L); Q2 (11.81, 15.25 μmol/L); Q3 (15.25, 20.12 μmol/L); Q4 (>20.12 μmol/L). Cholesterol quartile groups are divided into Q1 (≤125.26 mg/dL); Q2 (125.26, 154.25 mg/dL); Q3 (154.25, 186.73 mg/dL); Q4 (>186.73 mg/dL).