Figures & data
Table 1 Descriptive statistics of the sample
Table 2 Canonical and composite loadings of the “DXA” and “hematochemical” indicatorsTable Footnote*
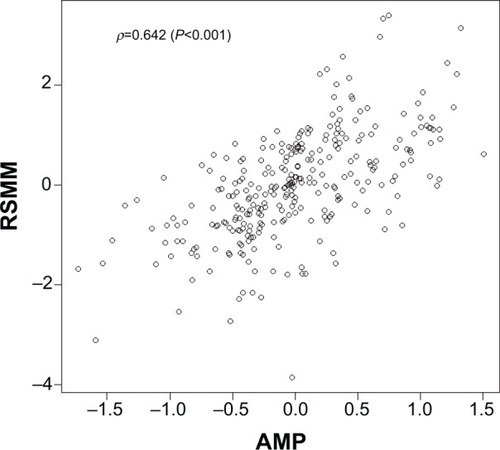
Figure 1 Scatterplot of the AMP and RSMM index (correlation=r =0.642). AMP is a composite variable defined by averaging the canonical variate pair of DXA and hematochemical indicators.
Abbreviations: AMP, adipo-metabolic profile; DXA, dual-energy X-ray absorptiometry; RSMM, relative skeletal muscle mass.