Figures & data
Figure 1 Dendrograms from cluster analysis applied to isolated or combined neuropsychological test results.
Abbreviation: CANTAB, Cambridge Neuropsychological Tests Automated Battery.
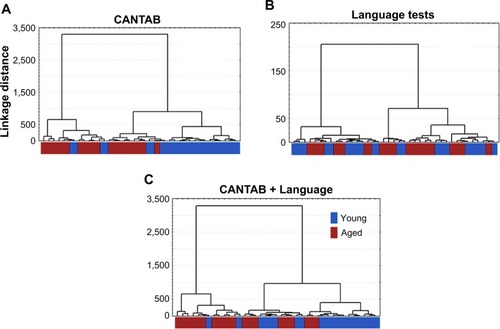
Table 1 Probability density values (P-values) from discriminant analysis to detect which neuropsychological tests best contributed to cluster formation, either in isolation or in combination
Figure 2 Graphic representations of forward stepwise discriminant function analysis based on isolated (A, B) or combined CANTAB and Language (C) tests results.
Abbreviations: CANTAB, Cambridge Neuropsychological Tests Automated Battery; RTI, reaction time; RVP, Rapid Visual Information Processing; SAS, simple accuracy score; SWM, Spatial Working Memory.
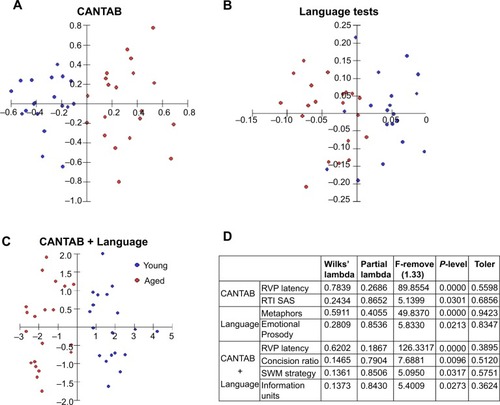
Figure 3 Graphic representations of mean scores and dispersion from the language test performances of young and older adults.
Notes: Narrative results based on information units (A), concision ratio (B), metaphors (C), and emotional prosody (D) revealed different degrees of dispersion, although the average values of older and young adults’ performances differed significantly. Mean values are indicated by black dots in both young (blue circles) and older (red circles) groups. Note the smaller dispersion in the concision ratio results from the narrative tests.
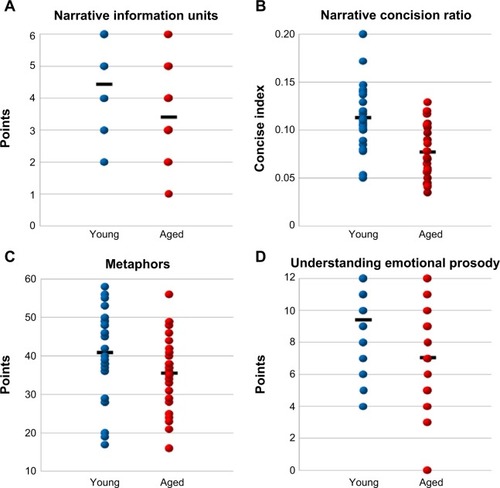
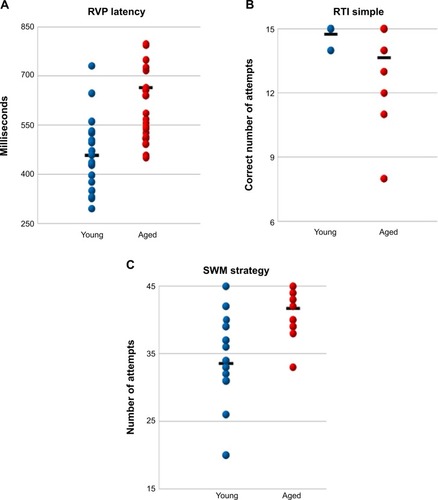
Figure 4 Graphic representations of mean scores and dispersion from CANTAB performances of young and older adults.
Abbreviations: CANTAB, Cambridge Neuropsychological Tests Automated Battery; RTI, reaction time; RVP, Rapid Visual Information Processing; SWM, Spatial Working Memory.