63
Views
6
CrossRef citations to date
0
Altmetric
Original Research

Application of creatinine- and/or cystatin C-based glomerular filtration rate estimation equations in elderly Chinese

, , , , &
Pages 1539-1549 | Published online: 11 Sep 2014

Figures & data

Table 1 Equations to estimate glomerular filtration rateTable Footnotea

Table 2 Baseline characteristics of enrolled elderly subjectsTable Footnotea

Table 3 Overall performance of the equationsTable Footnotea

Figure 1 Bland–Altman analysis measured and plotted to intuitively compare eGFR with rGFR. Horizontal solid lines represent the mean difference between methods. Horizontal dashed lines represent 95% limits of agreement. GFR was measured in mL/min/1.73 m2. (A) CKD-EPIscr, (B) CKD-EPIcys, (C) CKD-EPIscr-cys, (D) Jscr, (E) Jcys, (F) BISscr, (G) BISscr-cys, (H) CEscr, (I) Ccys, and (J) Cscr-cys.

Abbreviations: BISscr, Berlin equation based on scr; BISscr-cys, Berlin equation based on scr and cys C; Ccys, Chinese equation based on cys C; CEscr, Chinese elderly equation based on scr; CKD-EPI, Chronic Kidney Disease Epidemiology Collaboration; CKD-EPIcys, CKD-EPI equation based on cys C; CKD-EPIscr, CKD-EPI equation based on scr; CKD-EPIscr-cys, CKD-EPI equation based on scr and cys C; Cscr-cys, Chinese equation based on scr and cys C; eGFR, estimated glomerular filtration rate; Jcys, Japanese equation based on cys C; Jscr, Japanese equation based on scr; rGFR, reference glomerular filtration rate; scr, serum creatinine; cys C, cystatin C; SD, standard deviation.
Figure 1 Bland–Altman analysis measured and plotted to intuitively compare eGFR with rGFR. Horizontal solid lines represent the mean difference between methods. Horizontal dashed lines represent 95% limits of agreement. GFR was measured in mL/min/1.73 m2. (A) CKD-EPIscr, (B) CKD-EPIcys, (C) CKD-EPIscr-cys, (D) Jscr, (E) Jcys, (F) BISscr, (G) BISscr-cys, (H) CEscr, (I) Ccys, and (J) Cscr-cys.

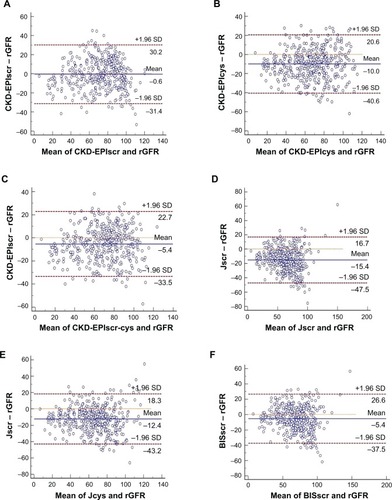
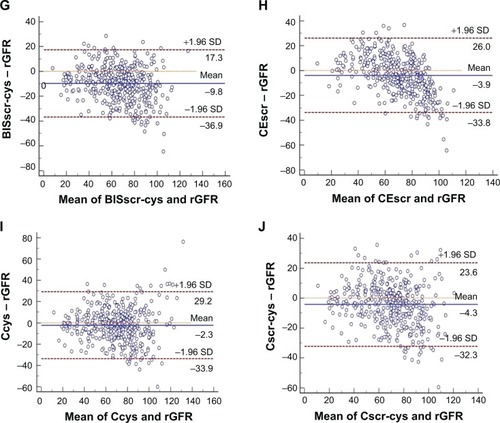
Table 4 Diagnosis consistency and misclassification rate of the equationsTable Footnotea

Table 5 GFR-specific performance of the equationsTable Footnotea

Table 6 Age-specific performance of the equations