
Figures & data
Figure 1 Flow chart of subjects through the study.
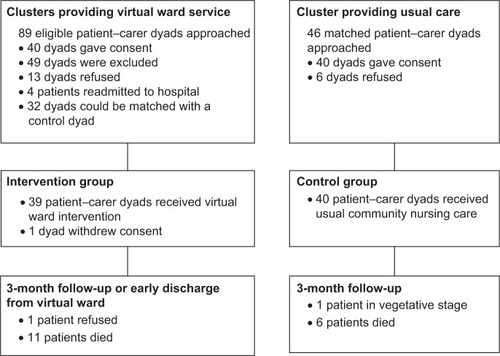
Table 1 Demographic characteristics of patients and carers by group (N=39)
Table 2 Comparison of changes in hospital services utilization from baseline to follow-up of matched patient pairs in the two groups
Table 3 Comparison of changes in hospital services utilization from baseline to follow-up of matched patient pairs in the two groups excluding those who died
Table 4 Comparison of changes in QOL scores from baseline to follow-up of the matched patients in the two groups