Figures & data
Figure 1 Ezure scoring scale.
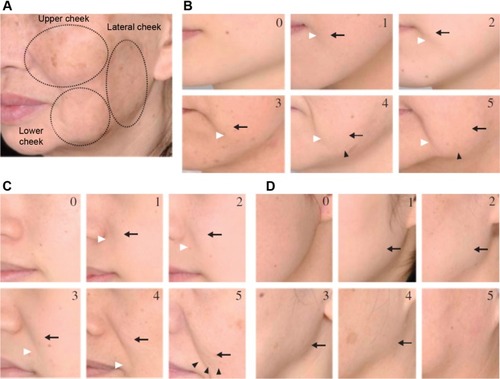
Figure 2 Double stimulation.
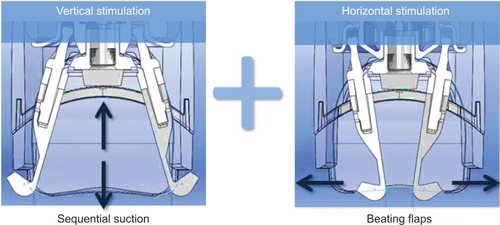
Table 1 Results of the skin sagging scores
Table 2 Results for CLBT™ scoring before (T0) and after (T1) the 24 treatment sessions
Figure 3 CLBT™ scoring before (T0) and after (T1) the 24 treatment sessions: results for the color components.
Notes: The visual analysis scale (CLBT scoringCitation12) follows seven descriptors that evaluate between 10% and 100% of four different colors: pink red (A), olive (B), beige (C), and light pink (D). All these color parameters presented a significant improvement (decrease) in terms of time/treatment evolution, in favor of the treated (blue) versus nontreated (red) side. *P<0.05.
Abbreviations: CLBT, Color, Luminosity, Brightness and Transparency Scoring; T, time.
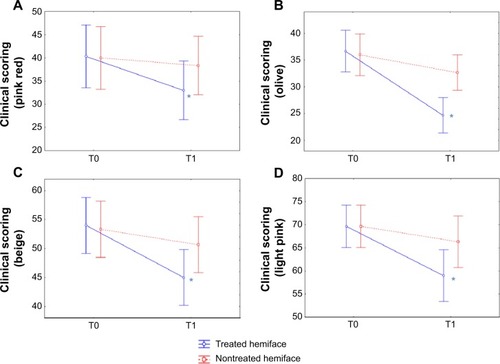
Figure 4 CLBT™ scoring before (T0) and after (T1) the 24 treatment sessions: results for transparency, brightness, and luminosity.
Abbreviations: CLBT, Color, Luminosity, Brightness and Transparency Scoring; T, time.
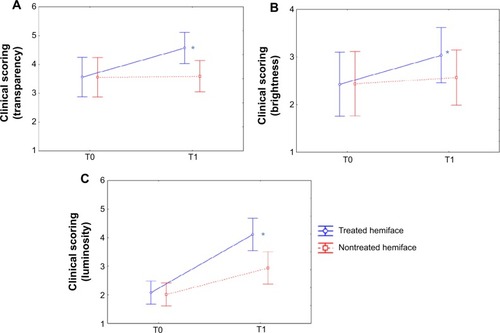
Table 3 Clinical scoring of skin radiance: evaluation through relief before (T0) and after (T1) the 24 treatment sessions
Figure 5 Clinical scoring of skin radiance: relief surface irregularity.
Abbreviation: T, time.
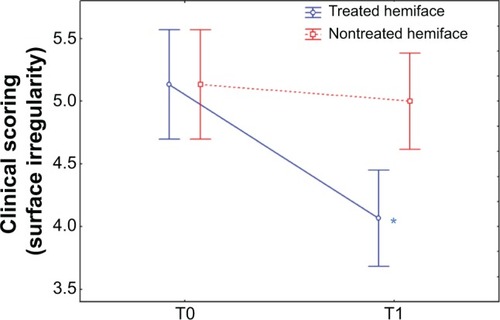
Table 4 Clinical scoring of skin radiance: evaluation through skin color before (T0) and after (T1) the 24 treatment sessions
Figure 6 Clinical scoring of skin radiance: color skin complexion heterogeneity.
Abbreviation: T, time.
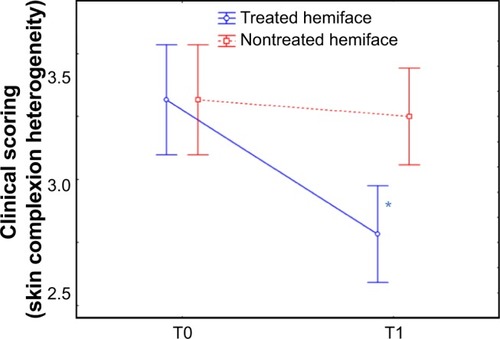
Table 5 Results of self-assessment evaluation
Table 6 Self-assessment of subjects skin at T1 (end of the treatment) and T2 (1 month after the end of the treatment), compared to T0
Figure 7 Skin sagging evolution during the study: examples on two volunteers treated on the left side of the face before and after 24 sessions of treatment.
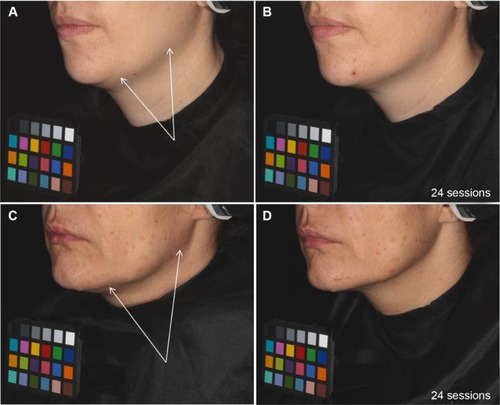
Figure 8 Effect of Mécano-Stimulation™ on fibroblast retraction according to time.
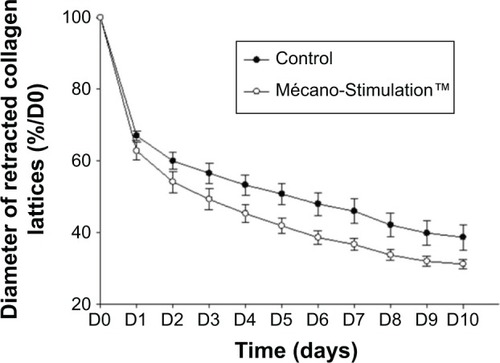
Figure 9 Quantification of contractile forces developed by fibroblasts after the action of Mécano-Stimulation™ using GlaSbox® device.
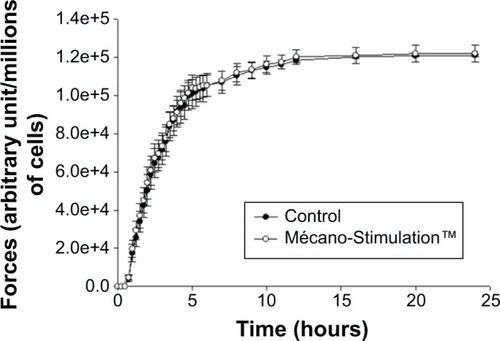
Figure 10 Collagen I, elastin, and hyaluronic acid synthesis of fibroblasts with and without the action of Mécano-Stimulation™.
Abbreviation: T, time.
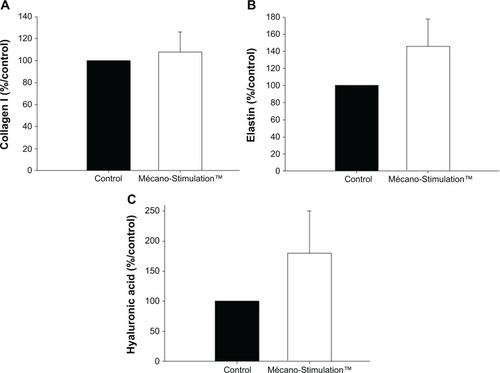
Figure 11 MMP-1, MMP-9, and TIMP-1 synthesis of fibroblasts with and without the action of Mécano-Stimulation™.
Abbreviations: MMP, matrix metalloproteinase; TIMP, tissue inhibitor of metalloproteinases; T, time.
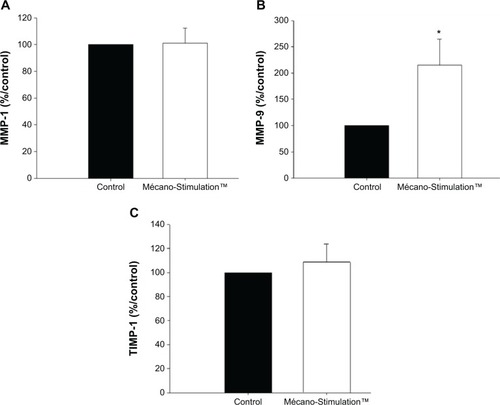
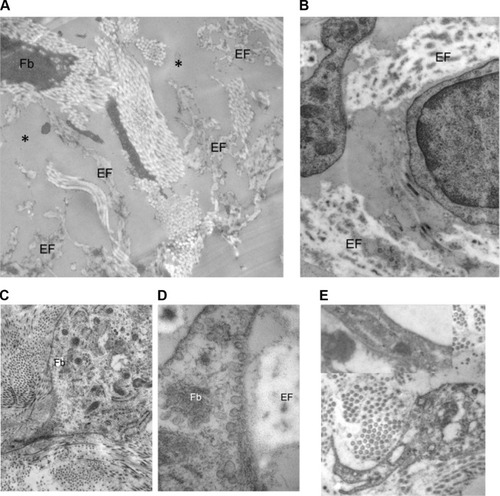
Figure 12 Examples of ultrastructure observed when comparing the treated versus untreated side.
Abbreviations: EFs, elastic fibers; Fb, fibroblasts.