Figures & data
Table 1 Characteristics of the included studies
Figure 1 Flowchart summarizing literature search results.
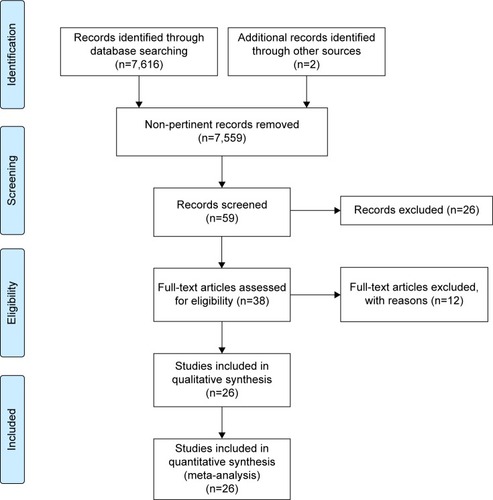
Figure 2 Forest plot summarizing the 30-day mortality.
Abbreviations: CI, confidence interval; Ev/Trt, event/treated.
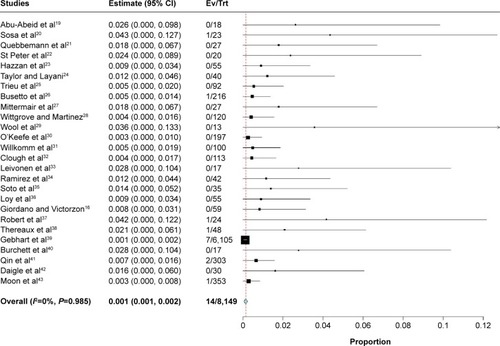
Figure 3 Forest plot summarizing the overall complications occurred.
Abbreviations: CI, confidence interval; Ev/Trt, event/treated.
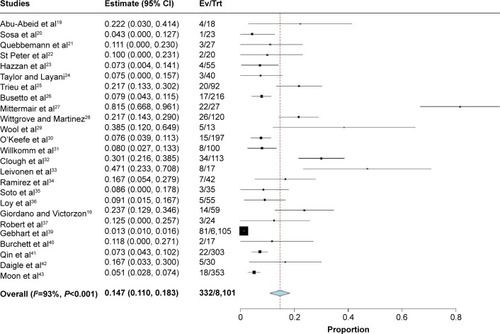
Figure 4 Forest plot summarizing the EWL% at 1-year follow-up or later.
Abbreviations: EWL, excess weight loss; CI, confidence interval.
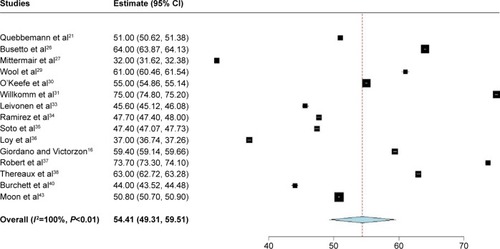
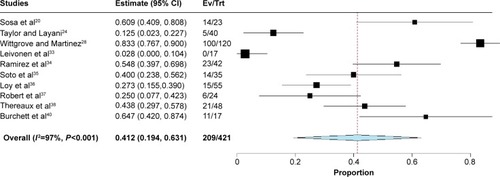
Figure 5 Forest plot summarizing the diabetes resolution at 1-year follow-up or later.
Abbreviations: CI, confidence interval; Ev/Trt, event/treated.
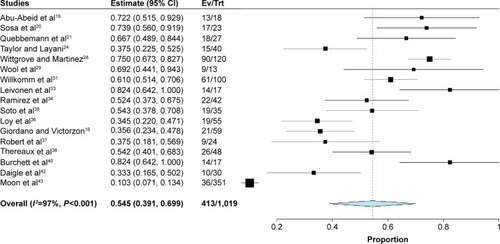
Figure 6 Forest plot summarizing the hypertension resolution at 1-year follow-up or later.
Abbreviations: CI, confidence interval; Ev/Trt, event/treated.
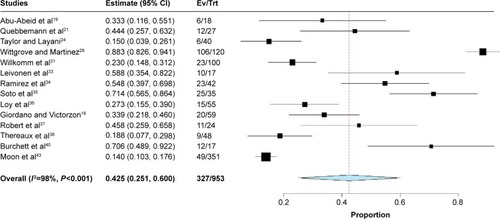
Figure 7 Forest plot summarizing the lipid disease resolution at 1-year follow-up or later.
Abbreviations: CI, confidence interval; Ev/Trt, event/treated.