Figures & data
Figure 1 Patient disposition.
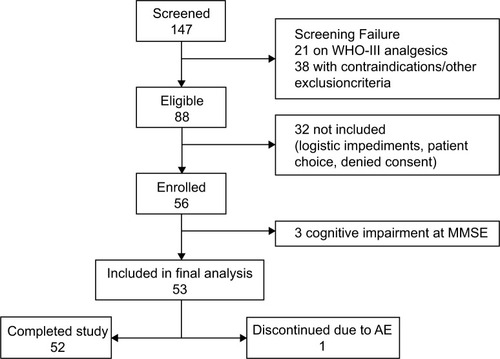
Table 1 Demographic and baseline characteristics of the study population
Figure 2 Distribution of prolonged-release oxycodone–naloxone (OXN-PR) daily dosages throughout the observation (expressed in oxycodone-equivalents). The 15 mg daily dosage was two 5/2.5 mg tablets in the morning and one in the evening, or vice versa, according to individual need and pain characteristics (three patients at day 7 [T7], one at day 14 [T14], and one at day 28 [T28]). There were two women (aged 75 and 80 years) who, after a few days of the new treatment, reduced their OXN-PR daily doses to only one 5/2.5 mg tablet in the morning because of drowsiness; in the following weeks, both increased their OXN-PR daily dose to 20/10 mg without major side effects. Two other women with severe knee pain due to osteoarthritis at the last follow-up visit had decreased their daily OXN-PR to one 5/2.5 mg tablet in the morning, nevertheless with satisfactory pain control.
![Figure 2 Distribution of prolonged-release oxycodone–naloxone (OXN-PR) daily dosages throughout the observation (expressed in oxycodone-equivalents). The 15 mg daily dosage was two 5/2.5 mg tablets in the morning and one in the evening, or vice versa, according to individual need and pain characteristics (three patients at day 7 [T7], one at day 14 [T14], and one at day 28 [T28]). There were two women (aged 75 and 80 years) who, after a few days of the new treatment, reduced their OXN-PR daily doses to only one 5/2.5 mg tablet in the morning because of drowsiness; in the following weeks, both increased their OXN-PR daily dose to 20/10 mg without major side effects. Two other women with severe knee pain due to osteoarthritis at the last follow-up visit had decreased their daily OXN-PR to one 5/2.5 mg tablet in the morning, nevertheless with satisfactory pain control.](/cms/asset/9a3cc5af-a8ca-457d-ab37-e0be7da75c3f/dcia_a_72521_f0002_b.jpg)
Table 2 Change in pain intensity (Numeric Rating Scale score) during the 28-day observation of oxycodone/naloxone prolonged-release treatment
Figure 3 “Waterfall” image of ultimate individual variations in pain severity (last 7 days mean values, Numeric Rating Scale) at the end of observation after 4 weeks of treatment with prolonged-release oxycodone–naloxone among the 52 patients who completed the observation: percentage changes from baseline values are reported. Below the dashed line indicates analgesic efficacy (≥30% decrease in mean Numeric Rating Scale).
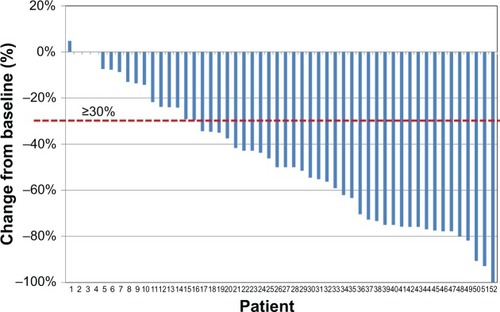
Figure 4 Proportions of patients with severe (Numeric Rating Scale [NRS] 7–10), moderate (NRS 4–6), mild (NRS 1–3), or no pain (NRS 0) at baseline and throughout the observation on prolonged-release oxycodone–naloxone (OXN-PR) (baseline: n=53; day 7 [T7], day 14 [T14], and day 28 [T28]: n=52). Four patients still complained of severe pain (mean NRS >6) after 28 days on OXN-PR. Three of them were on 20/10 mg OXN-PR daily and preferred not to further increase their daily dosage because of fear of increasing other symptoms potentially related to opioid (drowsiness in one, dry mouth in two). Another 85-year-old woman with severe osteoarthritic pain reported only modest analgesic benefit at the end of the 4-week observation on OXN-PR 10/5 mg daily. OXN-PR was deliberately not increased by her physician because of her unstable gait and history of falls.
![Figure 4 Proportions of patients with severe (Numeric Rating Scale [NRS] 7–10), moderate (NRS 4–6), mild (NRS 1–3), or no pain (NRS 0) at baseline and throughout the observation on prolonged-release oxycodone–naloxone (OXN-PR) (baseline: n=53; day 7 [T7], day 14 [T14], and day 28 [T28]: n=52). Four patients still complained of severe pain (mean NRS >6) after 28 days on OXN-PR. Three of them were on 20/10 mg OXN-PR daily and preferred not to further increase their daily dosage because of fear of increasing other symptoms potentially related to opioid (drowsiness in one, dry mouth in two). Another 85-year-old woman with severe osteoarthritic pain reported only modest analgesic benefit at the end of the 4-week observation on OXN-PR 10/5 mg daily. OXN-PR was deliberately not increased by her physician because of her unstable gait and history of falls.](/cms/asset/5e589a86-8b95-4abf-8c22-875a4423a9ac/dcia_a_72521_f0004_c.jpg)
Figure 5 Mean individual domain scores for pain-related functional impairment (measured by Numeric Rating Scale [NRS]) at baseline and at day 7 (T7), day 14 (T14), and day 28 (T28) of treatment with prolonged-release oxycodone–naloxone.
![Figure 5 Mean individual domain scores for pain-related functional impairment (measured by Numeric Rating Scale [NRS]) at baseline and at day 7 (T7), day 14 (T14), and day 28 (T28) of treatment with prolonged-release oxycodone–naloxone.](/cms/asset/6fcb94c8-c18c-4d0c-bc7b-827541ccb174/dcia_a_72521_f0005_b.jpg)
Figure 6 Constipation severity throughout the study, as assessed by Bowel Function Index (mean values ± standard deviation).
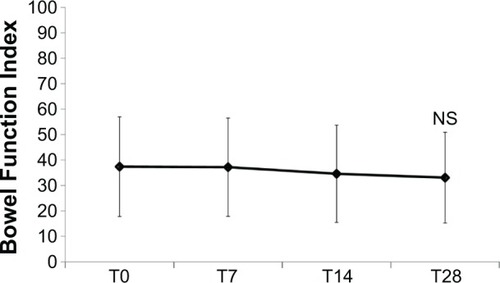
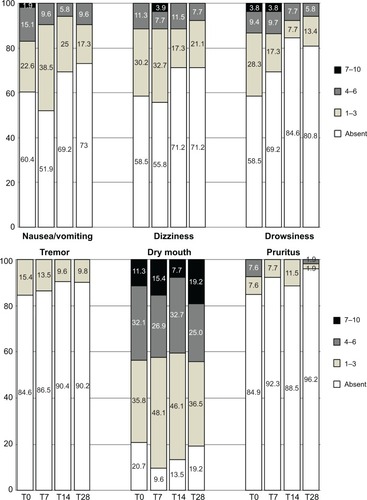
Figure 7 Proportions of patients affected by disorders commonly related to opioids and their severity at different time points of the observation. Symptom severity rated on an eleven-point scale (0=absent; 1–3=mild; 4–6=moderate, 7–10=severe). All differences in frequency distributions were not significant (corresponding P-values >0.0083 at all times).