
Figures & data
Table 1 Age distribution of patients
Figure 1 Findings on DRE.
Abbreviation: DRE, digital rectal examination.
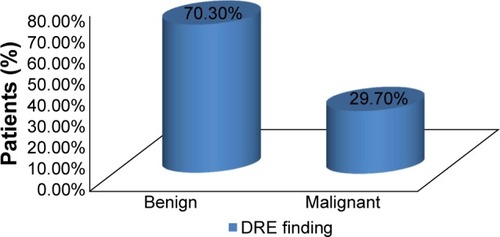
Table 2 Serum total prostate-specific antigen
Figure 2 Abdominopelvic ultrasound scan findings.
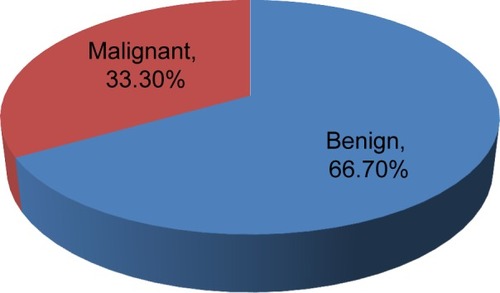
Table 3 Histology on transrectal core needle prostate biopsy
Table 4 Histology of prostatectomy specimens
Table 5 Relationship between age, DRE, serum tPSA, USS, and histology
Figure 3 Summary of histology.
Abbreviations: BPH, benign prostatic hyperplasia; PIN, prostatic intraepithelial neoplasia.
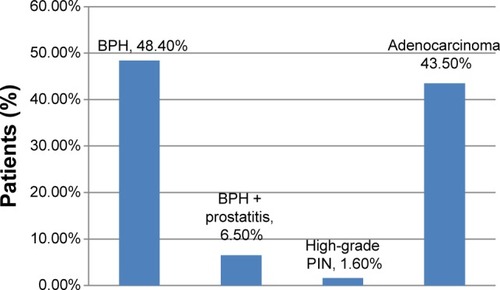
Table 6 Features of prostates with tPSA >4 ng/mL to 10 ng/mL
Table 7 Sensitivity parameters