Figures & data
Table 1 Selected baseline characteristics of participants by physical activity level
Table 2 Number of deaths and mortality rates over 11 years, by tertiles of energy expenditure at baseline
Table 3 Hazard ratio for 11-year mortality, by tertiles of energy expenditure at baseline
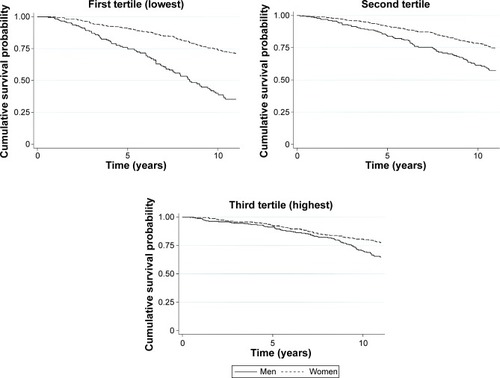
Figure 1 Cumulative survival probability estimates, adjusted for all confounders, by sex and tertiles of energy expenditure.
Notes: n=1,378; Curves adjusted by age, sex, years of education, interaction term between tertiles of energy expenditure and sex, current smoking, alcohol consumption, body mass index, systolic blood pressure, total cholesterol, fasting glucose, stroke, angina, infarct, Mini-Mental State Examination score and levels of B-type natriuretic peptide. First tertile: 0 to 515.0 MET-minute/week; Second tertile: 515.1 to 1,529.9 MET-minute/week; Third tertile: 1,530.0 to 16,765.5 MET-minute/week.
Abbreviation: MET, metabolic equivalent task.
Abbreviation: MET, metabolic equivalent task.