Figures & data
Table 1 FG subjects
Figure 1 Trunk angle calculation.
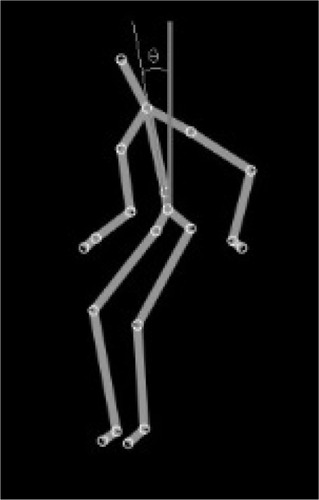
Figure 2 Comparison of trunk angle (A and B) and ratio (C and D) values between ten FG and ten YG subjects during STS and BTS.
Notes: The red circles represent the three subjects with worrying transfers. The solid line passes through the mean values for each group.
Abbreviations: BTS, back-to-sit; FG, frail group; STS, sit-to-stand; YG, young group.
Abbreviations: BTS, back-to-sit; FG, frail group; STS, sit-to-stand; YG, young group.
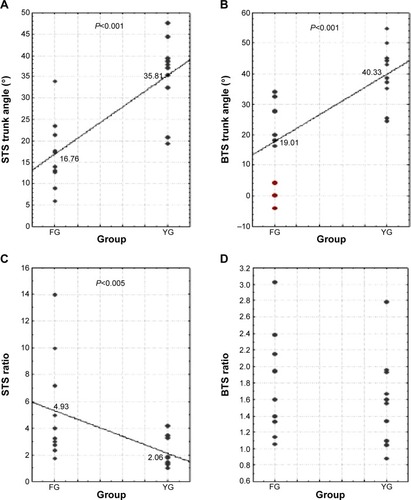
Figure 3 Distribution of the STS (A), BTS (B), and TUG (C) durations for ten FG and ten YG subjects.
Notes: The red circles represent the three subjects with worrying transfers. The solid line passes through the mean for each group.
Abbreviations: BTS, back-to-sit; FG, frail group; STS, sit-to-stand; TUG, Timed Up and Go; YG, young group.
Abbreviations: BTS, back-to-sit; FG, frail group; STS, sit-to-stand; TUG, Timed Up and Go; YG, young group.
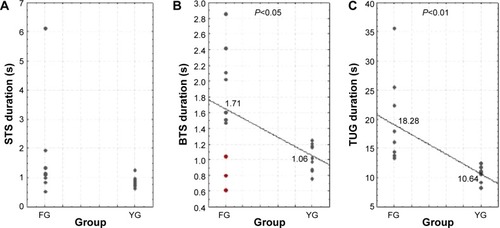
Table 2 Cohen’s d of the parameters that allow visualization of differences between FG and YG subjects
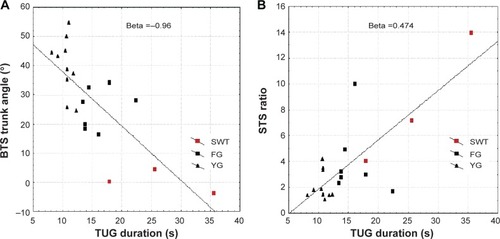
Figure 4 The distribution of the BTS trunk angles (A) and the STS ratio (B) relative to the TUG duration.
Notes: The red circles represent the three subjects with worrying transfers. The solid line denotes the line of best fit.
Abbreviations: BTS, back-to-sit; STS, sit-to-stand; TUG, Timed Up and Go; FG, frail group; YG, young group.
Abbreviations: BTS, back-to-sit; STS, sit-to-stand; TUG, Timed Up and Go; FG, frail group; YG, young group.