Figures & data
Table 1 Characteristics of the study participants
Table 2 Evaluation of oral function
Figure 1 Tongue–palate pressure test.
Notes: Intraoral positioning of the balloon (A). The placement of the tongue during measurement of maximum tongue pressure (large arrow) (B).
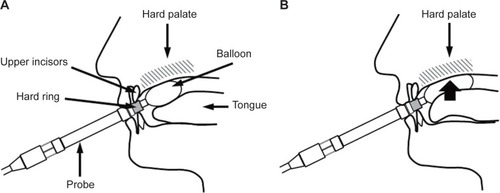
Table 3 Tongue pressure and number of swallows
Figure 2 Latency from the onset of each saliva swallow before and after meal consumption.
Notes: ANOVA showed that the time interval after the meal was longer compared to before the meal (P<0.05), and was longer in OAs compared to YAs (P<0.001).
Abbreviations: ANOVA, analysis of variance; YA, young adult; OA, older adult.
Abbreviations: ANOVA, analysis of variance; YA, young adult; OA, older adult.
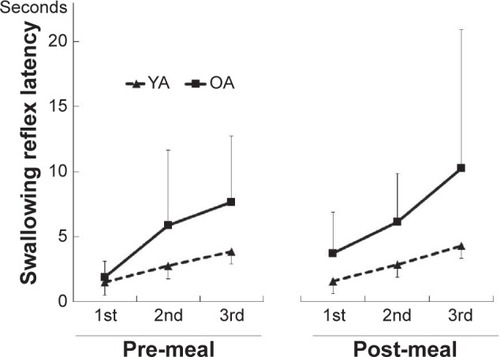
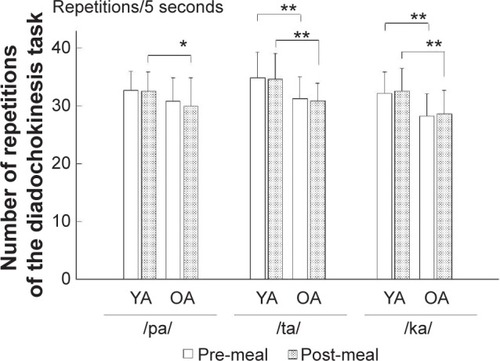
Figure 3 Total number of repetitions of the diadochokinesis task over 5 seconds, pre-meal and post-meal.
Notes: *P<0.05, **P<0.01, by Student’s t-test for /pa/ and /ta/, by Wilcoxon rank sum test for /ka/.
Abbreviations: YA, young adult; OA, older adult.
Abbreviations: YA, young adult; OA, older adult.