Figures & data
Figure 1 Representative photomicrographs of regenerating axons in all groups after ONC.
Notes: The numbers of axons/section are presented as the mean ± SD (n=10). (A) asterisk, the crush site; arrow heads, GAP-43 immunofluorescence; scale bar, 50 μm. (B) **P<0.001 compared with the PBS group; #P<0.05 compared with the low BMSC group.
Abbreviations: ONC, optic nerve crush; SD, standard deviation; BMSC, bone marrow mesenchymal stem cell; PBS, phosphate buffered saline.
Abbreviations: ONC, optic nerve crush; SD, standard deviation; BMSC, bone marrow mesenchymal stem cell; PBS, phosphate buffered saline.
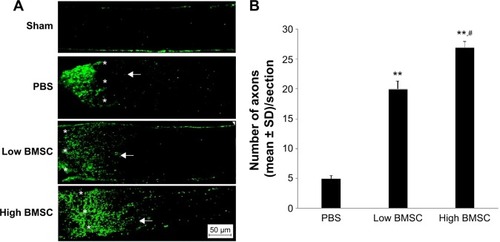
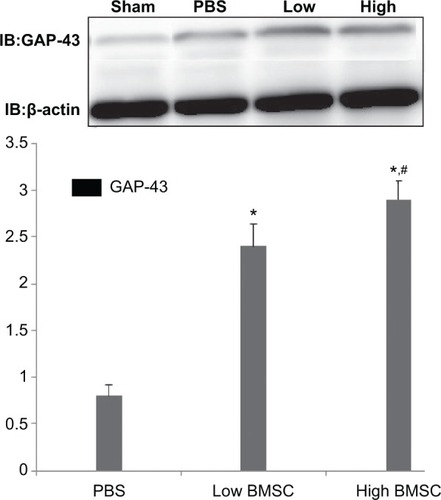
Figure 2 Western blot analysis of GAP-43 expression.
Notes: *P<0.001, compared with the PBS group; #P<0.05, compared with the low BMSC group.
Abbreviations: BMSC, bone marrow mesenchymal stem cell; IB, immunoblotting; PBS, phosphate buffered saline.
Abbreviations: BMSC, bone marrow mesenchymal stem cell; IB, immunoblotting; PBS, phosphate buffered saline.