Figures & data
Table 1 Highest dose cohort by index dose
Table 2 Highest dose cohort antidiabetic medication use – by insulin dosage
Table 3 Estimated direct medical costs by dose
Table 4 Resource utilization and index dose
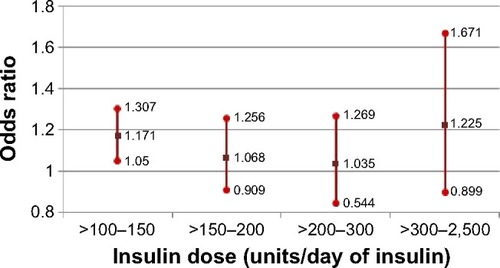
Figure 1 Probability of PDC ≥80% (odds ratios and 95% CIs).
Abbreviations: PDC, proportion of days covered; CIs, confidence intervals.
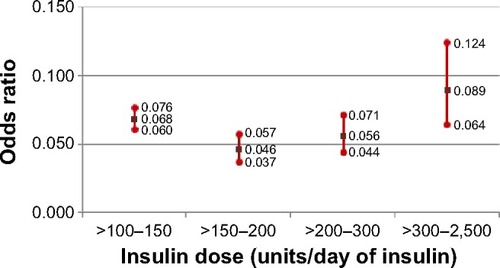
Figure 2 Probability of hypoglycemic event (odds ratios and 95% CIs).
Abbreviation: CIs, confidence intervals.