Figures & data
Figure 1 KineSpring® Knee Implant System.
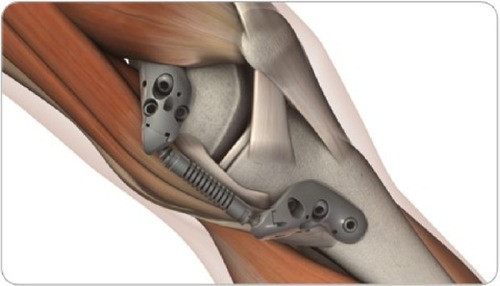
Figure 2 Semiautomated regions of interest by KneeAnalyzer.
Notes: Joint space boundary profiles for femur (blue); Joint space boundary profiles for tibial plateau at both the lateral compartment (red) and the medial (green) compartments; Regions for fractal signature analysis in the medial and lateral subchondral bone (light green boxes); Minimum joint width at the lateral compartment and the medial compartments (black).
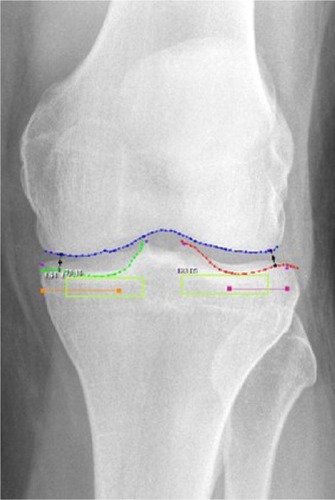
Figure 3 Representative fractal signature curves, demonstrating fractal dimensions at the tibial cortex over a range of trabecular widths from 0.4 to 3.0 mm.
Abbreviation: FSA, fractal signature analysis.
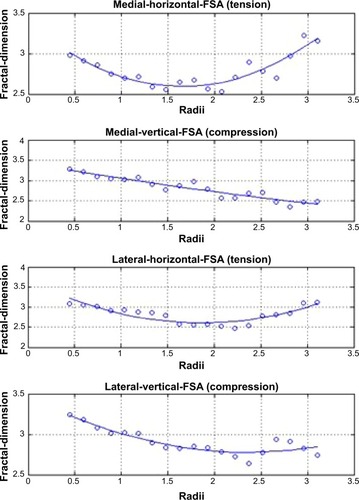
Table 1 Baseline patient characteristics
Figure 4 Change in WOMAC subscores over 2 years following joint unloading implant.
Abbreviations: WOMAC, Western Ontario and McMaster Universities Osteoarthritis Index; yr, years.
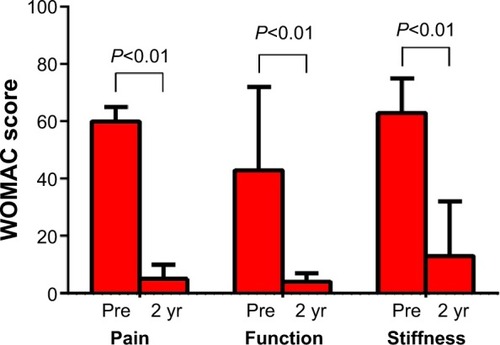
Figure 5 Change in joint space width over 2 years following joint unloading implant.
Abbreviation: yr, years.
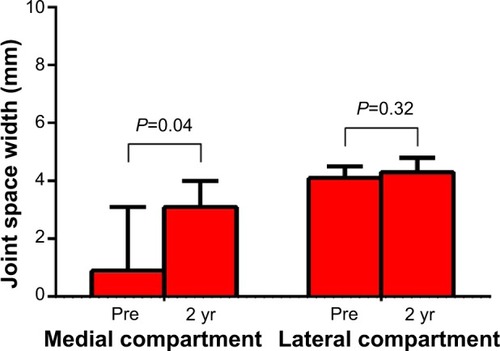
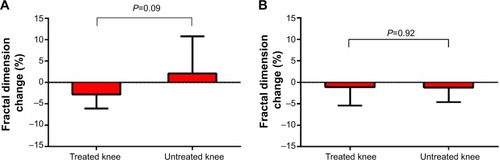
Figure 6 Change in subchondral tibial fractal signatures for (A) vertical and (B) horizontal oriented trabeculae over 2 years following joint unloading implant.