
Figures & data
Table 1 Patient characteristics and their correlations with NT-proBNP values, along with their unadjusted influences on mortality
Table 2 Independent risk factors of mortality
Figure 1 Kaplan–Meier estimate of survival for all subjects according to the quartile of NT-proBNP values.
Abbreviation: NT-proBNP, N-terminal pro-B-type natriuretic peptide.
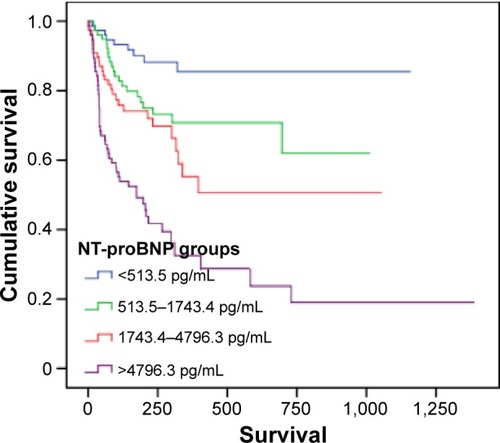
Table 3 Prognostic abilities of NT-proBNP values and model based on NT-proBNP values compared with the SHFS
Figure 2 Comparison of c-statistic between NT-proBNP values, SHFS, and our model based on NT-proBNP values.
Abbreviations: NT-proBNP, N-terminal pro-B-type natriuretic peptide; SHFS, Seattle Heart Failure Score.
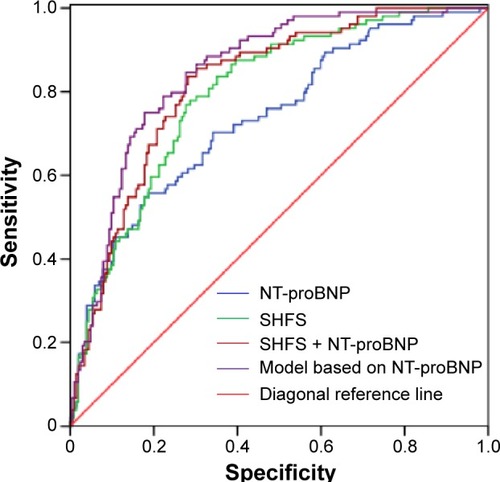
Table 4 Independent determinants of NT-proBNP values