Figures & data
Table 1 Patient demographics and comparisons between groups
Figure 1 Histogram representing the percentage of PXF among each of the groups in the study.
Abbreviations: PXF, pseudoexfoliation syndrome; CRVO, central retinal vein occlusion; BRVO, branch retinal vein occlusion.
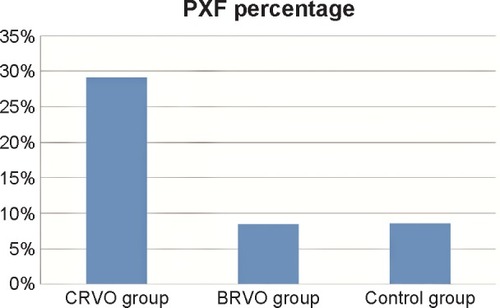
Table 2 Comparison between ischemic and non-ischemic CRVO
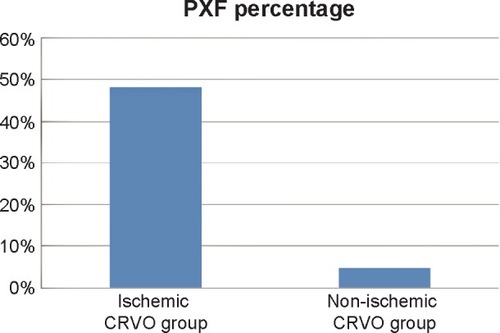
Figure 2 Histogram representing the percentage of PXF in the two subgroups of ischemic central retinal vein occlusion (CRVO) and non-ischemic CRVO.
Abbreviation: PXF, pseudoexfoliation syndrome.