
Figures & data
Table 1 Sociodemographic and clinical characteristics of the studied population
Figure 1 Relationships between the TFI values and values of the ADL (A), IADL (B), HADS (C), and MMSE (D) scales.
Abbreviations: ADL, Katz Index of Independence in Activities of Daily Living; HADS, Hospital Anxiety and Depression Scale; IADL, The Lawton Instrumental Activities of Daily Living Scale; MMSE, Mini-Mental State Examination; TFI, Tilburg Frailty Indicator.
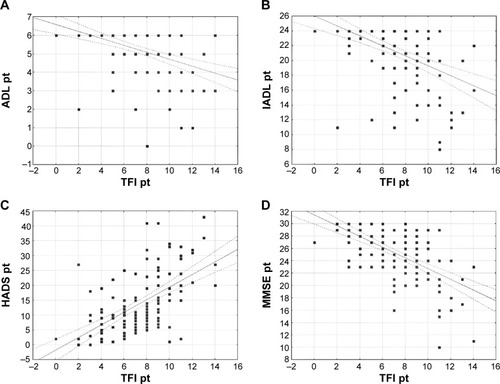
Figure 2 Relationships between the values of the physical dimension of the TFI and the values of the ADL (A) and IADL (B) scales, and between the values of the mental dimension of the TFI and the values of the HADS (C) and MMSE (D) scales.
Abbreviations: ADL, Katz Index of Independence in Activities of Daily Living; HADS, Hospital Anxiety and Depression Scale; IADL, The Lawton Instrumental Activities of Daily Living Scale; MMSE, Mini-Mental State Examination; TFI, Tilburg Frailty Indicator.
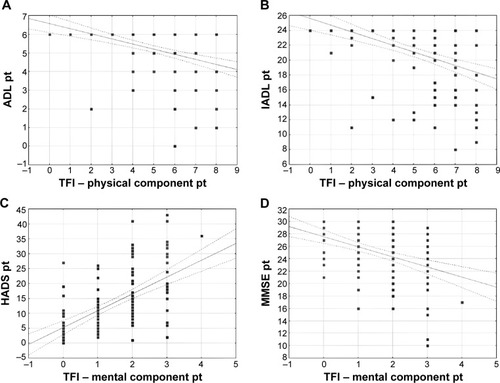
Figure 3 Statistical characteristics of the values of the ADL (A), IADL (B), HADS (C), and MMSE (D) scales in the subgroups of patients with the TFI values ≥5 and <5.
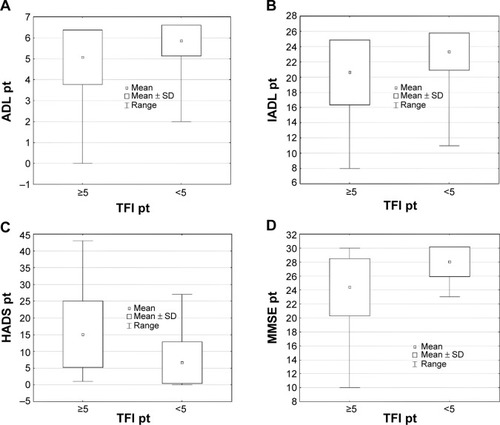
Table 2 Distribution of the number and percentage of patients with different values of the ADL, HADS, and MMSE scales in the subgroups of patients with the TFI values ≥5 and <5