
Figures & data
Figure 1 Study framework.
Note: Framework: combining eight components into one generic composite endpoint (TOPICS-CEP) and the influence of rater characteristics.
Abbreviations: QOL, quality of life; TOPICS-CEP, The Older Persons and Informal Caregivers Survey – Composite Endpoint index.
Abbreviations: QOL, quality of life; TOPICS-CEP, The Older Persons and Informal Caregivers Survey – Composite Endpoint index.
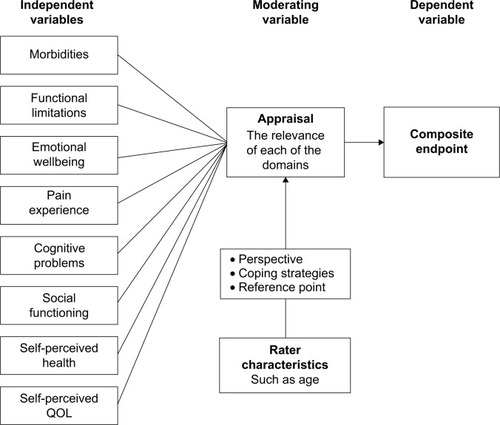
Table 1 Linear mixed models with interaction terms between the raters’ age and each of the TOPICS-CEP components
Table 2 TOPICS-CEP models based on the health state preferences of 65-year-old versus 85-year-old persons
Figure 2 Bland–Altman plot of TOPIC-CEP scores of 65-year-old versus 85-year-old persons.
Notes: Bland–Altman plot: difference between CEP scores of the vignette cases based on preferences of 65-year-old versus 85-year-old persons plotted against their average. Bold solid line represents the average difference between methods; dotted lines represent the 95% confidence limits.
Abbreviations: QOL, quality of life; TOPICS-CEP-65, The Older Persons and Informal Caregivers Survey – Composite Endpoint scores for 65-year-old persons; TOPICS-CEP-85, The Older Persons and Informal Caregivers Survey – Composite Endpoint scores for 85-year-old persons.
Abbreviations: QOL, quality of life; TOPICS-CEP-65, The Older Persons and Informal Caregivers Survey – Composite Endpoint scores for 65-year-old persons; TOPICS-CEP-85, The Older Persons and Informal Caregivers Survey – Composite Endpoint scores for 85-year-old persons.
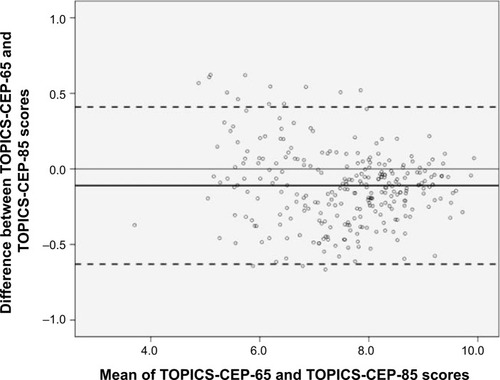
Table S1 The health outcome domains, their preference weights, items per component, and levels per item
Table S2 The original TOPICS-CEP components’ weights and the weights adjusted for the age distribution of older persons (≥65 years old) in the Netherlands