Figures & data
Table 1 Personal questionnaire results of the group of seniors
Table 2 Differences in the structural characteristics between the groups of Seniors (S) and University of the Third Age attendees (U3A)
Table 3 Differences in the functional characteristics between the groups of Seniors (S) and University of the Third Age attendees (U3A)
Table 4 Regression coefficients of the structural characteristics as a function of age
Table 5 Regression coefficients of the functional characteristics as a function of age
Figure 1 Changes with age in bone mineral density (BMD) in the groups of active (U3A) and inactive (S) women.
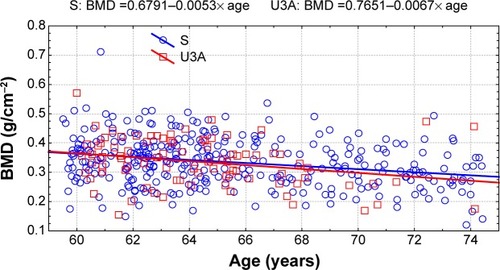
Figure 2 Changes with age in 8-foot Up-and-Go test in the groups of active (U3A) and inactive (S) women.
Abbreviations: S, Senior Women; U3A, University of the Third Age.
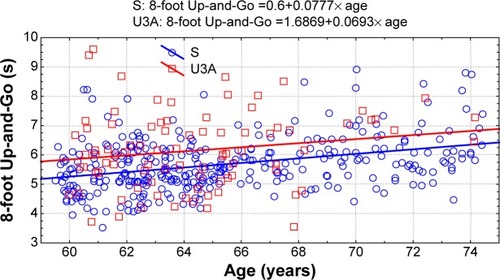
Figure 3 Changes with age in forced vital capacity (FVC) in the groups of active (U3A) and inactive (S) women.
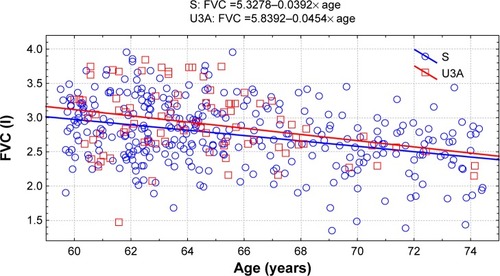
Figure 4 Changes with age in knee extensor muscle strength in the groups of active (U3A) and inactive (S) women.
Abbreviations: S, Senior Women; U3A, University of the Third Age.
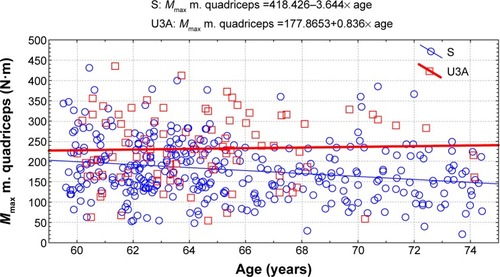
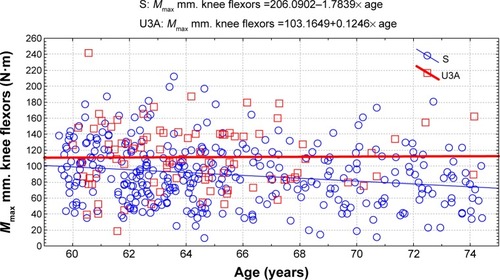
Figure 5 Changes with age in knee flexor muscle strength in the groups of active (U3A) and inactive (S) women.