Figures & data
Figure 1 Experimental design (flow diagram).
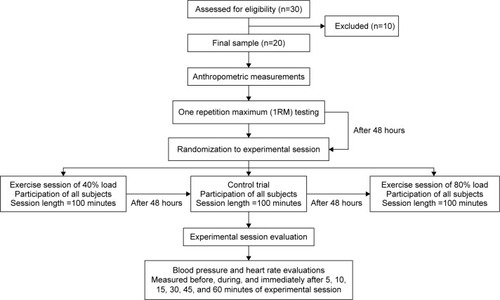
Table 1 Sample characteristics
Figure 2 Values expressed as the mean ± standard error deviation of postexercise hypotension at control trial.
Notes: (A) Systolic blood pressure (SBP); (B) diastolic blood pressure (DBP); (C) mean blood pressure (MBP); (D) heart rate (HR); and (E) rate-pressure product (RPP). *P<0.01 indicates statistically significant differences to rest. #Indicates statistically significant differences to control trial.
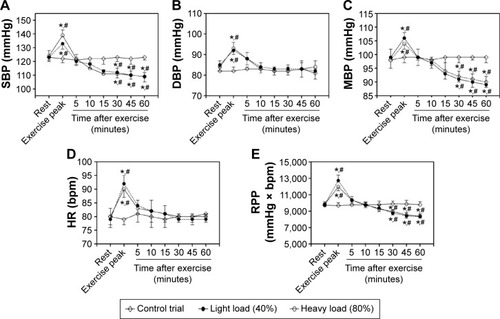
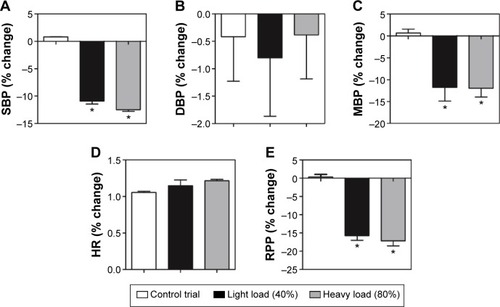
Figure 3 Relative change (%) expressed as the mean ± standard error deviation of systolic blood pressure (A), diastolic blood pressure (B), mean blood pressure (C), heart rate (D), and rate-pressure product (E) to control trial, light load (40%), and heavy load (80%).
Note: *P<0.01 indicates statistically significant differences to control.
Abbreviations: DBP, diastolic blood pressure; HR, heart rate; MBP, mean arterial blood pressure; RPP, rate-pressure product; SBP, systolic blood pressure.
Abbreviations: DBP, diastolic blood pressure; HR, heart rate; MBP, mean arterial blood pressure; RPP, rate-pressure product; SBP, systolic blood pressure.