
Figures & data
Table 1 The mini-mental state examination and language tests scores after multisensory and cognitive intervention in the institutionalized group
Table 2 The mini-mental state examination and language tests scores after multisensory and cognitive intervention in the noninstitutionalized group
Figure 1 Graphical representations of the mean and standard errors of test scores on the MMSE and language tests in the institutionalized (blue bars) and noninstitutionalized (red bars) groups as a function of time.
Abbreviations: MMSE, mini-mental state examination; mo, months; I, institutionalized; NI, noninstitutionalized.
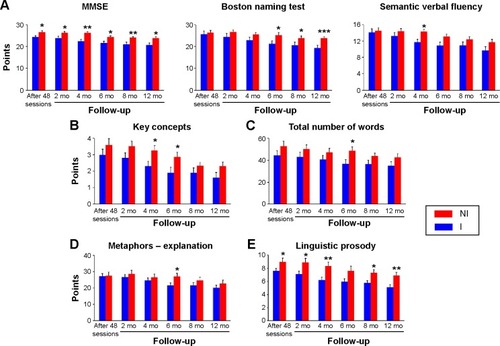
Figure 2 Graphical representations of the mean and standard error of tests scores in the institutionalized (circles) and noninstitutionalized (squares) groups as a function of time to illustrate the influence of time and institutionalization on (A) mini-mental state examination (MMSE) and (B) linguistic prosody test score reduction.
Abbreviations: I, institutionalized; NI, noninstitutionalized; mo, months.
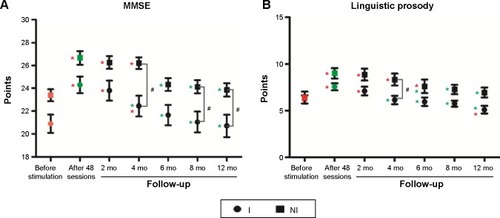
Table 3 Cognitive scores on MMSE and language tests before stimulation workshops in institutionalized (I) and noninstitutionalized (NI) elderly