Figures & data
Table 1 Demographic data
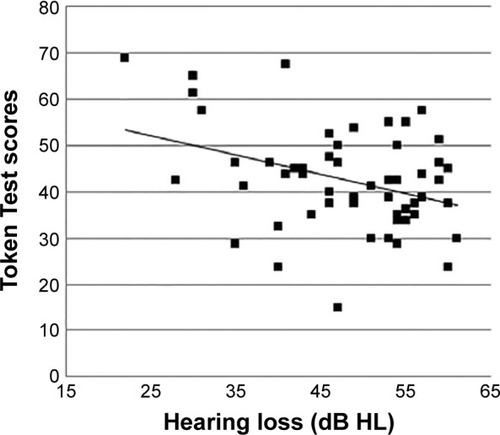
Figure 1 Mean hearing loss (dB hl) with standard deviations as error bars in the better-hearing ear for the predementia and dementia groups plotted as a function of tone frequency.
Abbreviation: dB HL, decibels of hearing level.
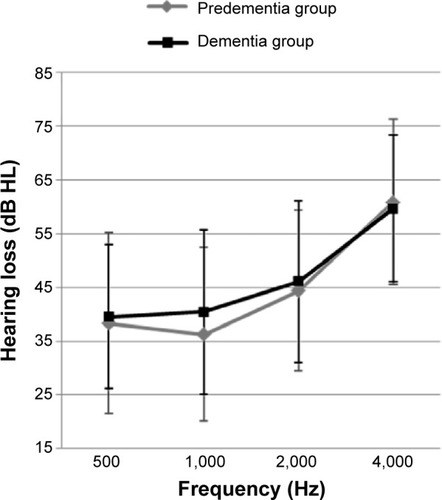
Table 2 Audiometric and language scores as a function of global Deterioration scale group
Table 3 Correlation between hearing loss and language scores as a function of global Deterioration scale group
Figure 2 Scatterplot showing a moderate negative linear relationship between Token Test scores and hearing loss in the predementia group.
Abbreviation: dB hl, decibels of hearing level.