
Figures & data
Figure 1 Two nonidentical binary images (A, B) with similar statistical properties in their nonzero voxel distribution, and their corresponding two-point correlation functions (C). The horizontal axis of the plot in C indicates the distance between voxels, and the vertical axis indicates the probability of finding two black voxels at a given distance. Because there is no spatial clustering in images A and B, S2 drops off rapidly as a function of distance in C.
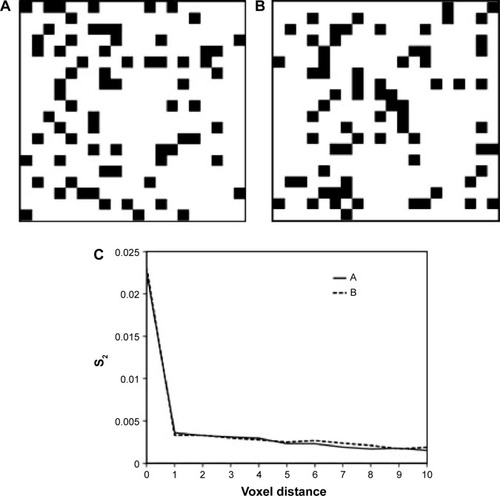
Figure 2 Three binary images with equal fractions of nonzero voxels. In (A) the black voxels are randomly distributed, while in (B) and (C) they are increasingly clustered. (D) The S2 functions of the three images are compared. As the clustering of nonzero voxels increases, the value of S2 at shorter distances increases, as does the area under the curve.
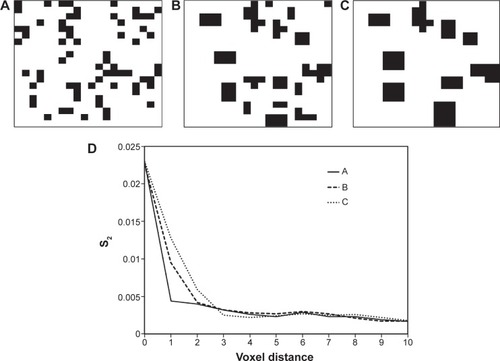
Figure 3 Illustration of weighting schemes in S2 and wS2. The conventional S2 metric utilizes a binary weighting scheme where each event is weighted as either zero (if one or both voxels are zero) or one (if both voxels are nonzero). In wS2, we utilize Equationequation 1(1) to calculate the weighting factor. The higher and the closer the voxel values, the higher the weighting factor of the event.
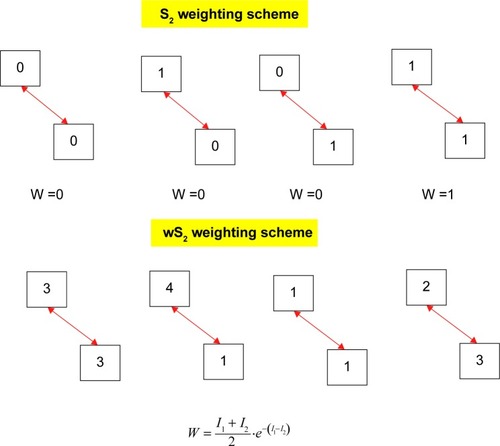
Figure 4 Weighted two-point correlation functions (D) of three simulated continuous-valued (nonbinary) images (A–C).
Note: Area under the curve and its slope change in figure D with the clustered increase of activity in images A, B and C. The image with the smallest cluster (A) corresponds to the function with smallest area under the curve. The image with highest and largest cluster of activity (C) shows the two-point correlation with largest area under the curve.
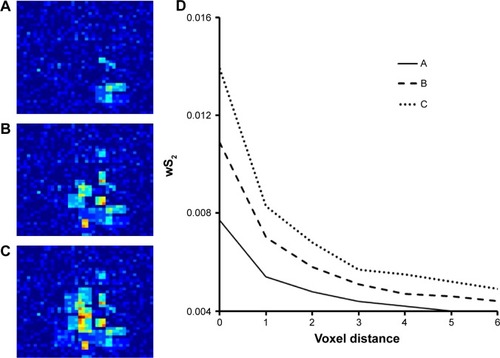
Figure 5 Four sample images of 11C-Pittsburgh compound B in four different regions of three subjects from the Alzheimer’s Disease Neuroimaging Initiative. The regional activity distribution of the baseline images (A, C, E, G) are compared with their follow-up time points (B, D, F, H). There is a clearly noticeable localized pattern of clustered activity, which seems to remain in the same area and is slightly spread within the course of 12–24 months. (A, B) Right temporal lobe in subject 010_S_04129. (B, C) Left temporal lobe in subject 005_S_0546. (D, E) Left frontal lobe in subject 041_S_0898. (G, H) Occipital lobe in subject 041_S_0898.
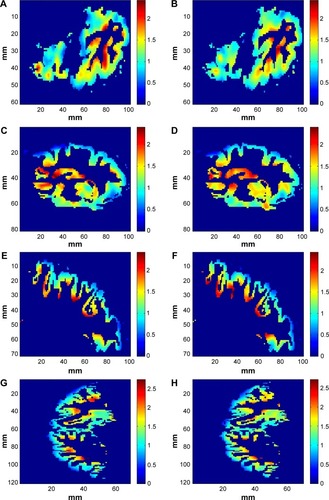
Table 1 Clinical data for Alzheimer’s Disease Neuroimaging Initiative subjects used for this study
Table 2 Outcome results for the two mixed-effects models investigating the effect of region size (number of gray matter voxels) and difference between baseline and follow-up injected dose (noise mismatch) on changes in the AUC
Figure 6 11C-Pittsburgh compound B image from the right temporal lobe at baseline (A) and follow-up (B) positron emission tomography scan. Mean standardized uptake value ratio values for images (C) at baseline and (D) follow-up showing their wS2 curves.
Abbreviation: SUVR, standardized uptake value ratio.
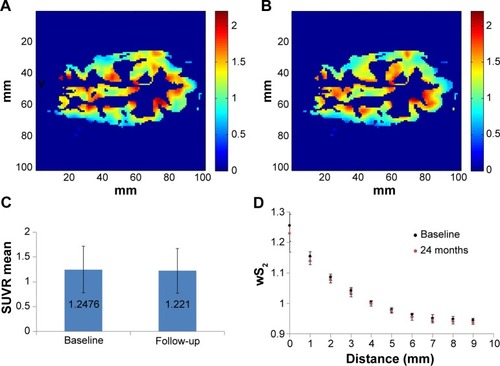
Figure 7 11C-Pittsburgh compound B image from the left parietal lobe at baseline (A) and follow-up (B) positron emission tomographic scan. (C) Mean standardized uptake value ratio values for images at baseline and follow-up and (D) their wS2 curves.
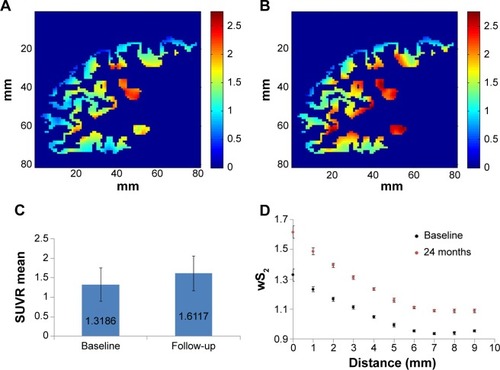
Table 3 Spearman’s rank correlation coefficients and P-values between the AUC/SUVR mean/SUVR median and 1/Aβ in cerebrospinal fluid