
Figures & data
Table 1 Demographics and baseline characteristics
Figure 1 Change in median serum procollagen type I N-terminal propeptide (PINP) from baseline to specific time points.
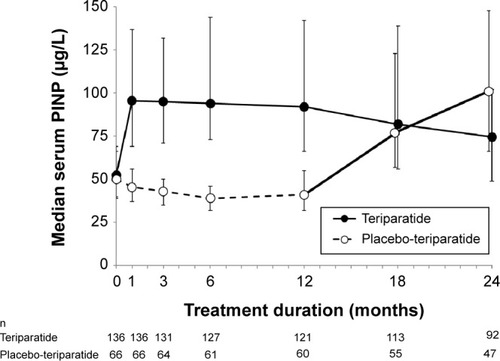
Figure 2 Comparison of distribution of serum procollagen type I N-terminal propeptide (PINP) concentration at baseline to that at 1, 3, 6, and 12 months (A, B, C, and D, respectively) in the placebo (open markers) and teriparatide (shaded markers) groups.
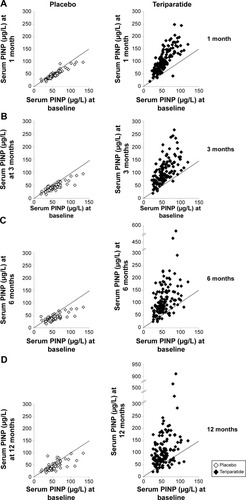
Figure 3 Kaplan–Meier plot of time-to-onset of nausea (A), headache (B), leg cramp (C), and dizziness (D) in the placebo-teriparatide and teriparatide groups.
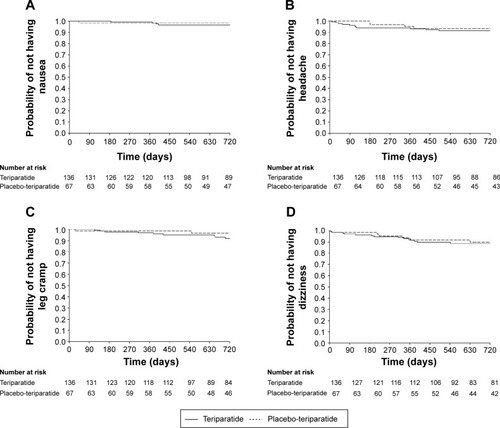
Figure 4 Median serum calcium concentration over time in the teriparatide (A) and placebo-teriparatide (B) groups.
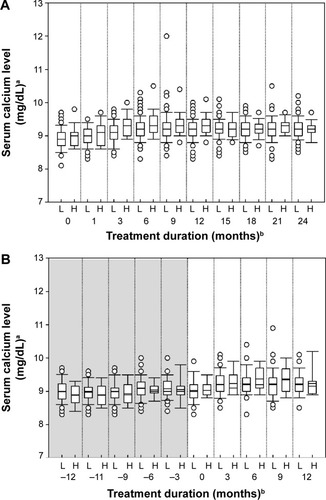
Table 2 Adverse events related to abnormal bone metabolism, metastatic bone tumors, or other metabolic bone diseases