Figures & data
Figure 1 Patient disposition.
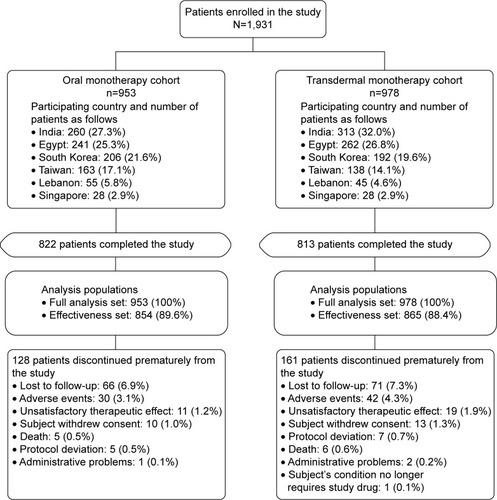
Table 1 Patient demographics and baseline characteristics
Figure 2 Caregiver preference for oral or transdermal medication at the end of the study, by prior exposure.
Notes: *A P-value of <0.05 indicates a statistically significant difference in proportions between the two cohorts. P-value is based on a binomial test statistic to compare two proportions. The 95% CIs were calculated as exact binomial CIs. Exposed to oral and transdermal patch medication, of the 308 questionnaires, two were answered after patient switched from baseline therapy and were therefore not considered for statistical analyses. aPatients in the effectiveness set with missing caregiver preference assessment were not included in the calculations.
Abbreviation: CI, confidence interval.
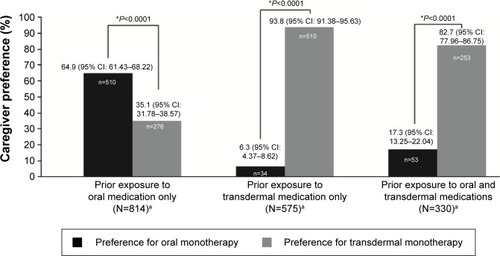
Figure 3 Caregiver assessment of patient compliance to treatment at the end of the study.
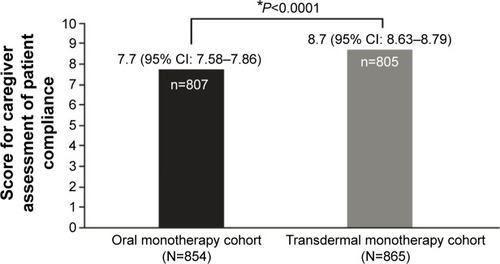
Figure 4 First ranking reason for physician preference for patch medication at the end of the study.
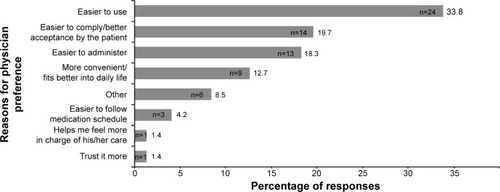
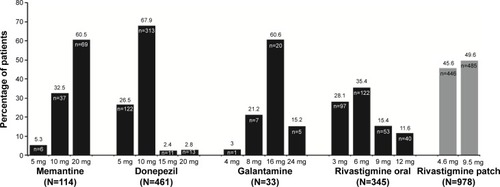
Figure 5 Drug regimen among patients on cholinesterase inhibitors and memantine at the end of the study.