
Figures & data
Figure 1 Flow chart showing patient enrolment and analysis.
Abbreviations: EA, epidural anesthesia; PNB, peripheral nerve block; FNF, femoral neck fracture.
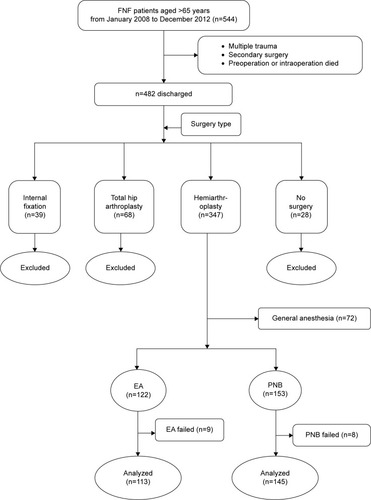
Table 1 Comparison of demographics for 258 elderly patients receiving epidural anesthesia or PNB
Table 2 Intraoperative and postoperative data for 258 elderly patients receiving epidural anesthesia or PNB
Table 3 Preoperative comorbidity, postoperative complications and mortality of 258 elderly patients in EA and PNB groups
Table 4 Univariate Cox regression analysis of the variables for 30-day and 1-year mortality
Table 5 Multivariate Cox regression analysis of the variables for 30-day and 1-year mortality