Figures & data
Table 1 Comparison of anthropometric, blood pressure, triglycerides, C-reactive protein, and strength variables between preintervention and postintervention (n=22)
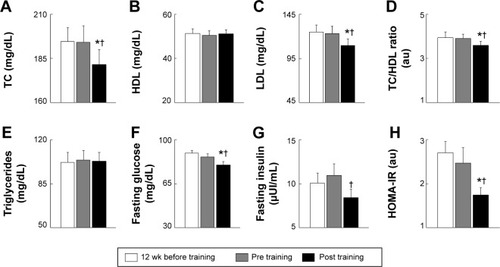
Figure 1 Mean values and standard error for variables related to lipid profile and glycemic control 12 weeks before training initiation and before and after the training period.
Notes:
†Significantly different in relation to 12 weeks before training initiation (P<0.01). *Significantly different in relation to baseline (P<0.01). (A), TC; (B), HDL-C; (C), LDL-C; (D), TC/HDL ratio; (E), triglycerides; (F), fasting blood glucose; (G), fasting blood insulin; and (H), HOMA-IR.
Abbreviations: TC, total cholesterol; HDL-C, high-density lipoprotein cholesterol; LDL-C, low-density lipoprotein cholesterol; HOMA-IR, homeostatic model of insulin resistance; au, arbitrary unit.
Abbreviations: TC, total cholesterol; HDL-C, high-density lipoprotein cholesterol; LDL-C, low-density lipoprotein cholesterol; HOMA-IR, homeostatic model of insulin resistance; au, arbitrary unit.