
Figures & data
Table 1 Key indicators of the diabetes specialist nursing service
Figure 1 Quality improvement in the storage of insulin that is currently in use.
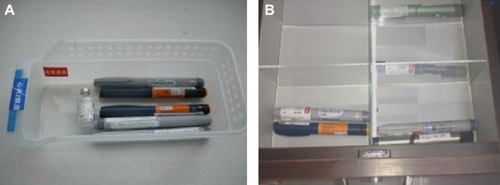
Table 2 Auditing pharmacists’ focus on clinically relevant drug interactions related with oral antidiabetic drugs
Figure 2 Look-alike/sound-alike insulin analogs.
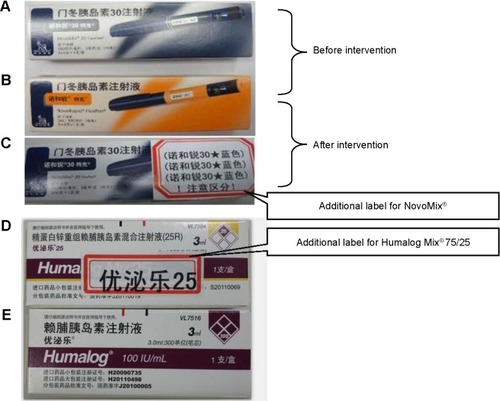
Figure 3 Number of MAEs related to insulin during 2011–2014.
Abbreviation: MAEs, medication administration errors.
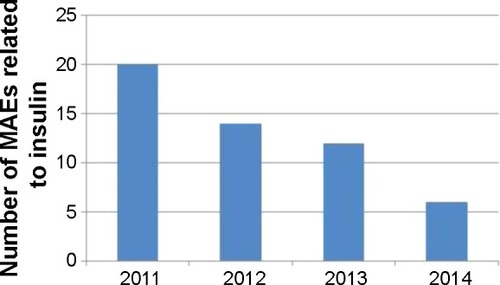
Figure 4 Subtype distribution of medication administration errors related to insulin during 2011–2014.
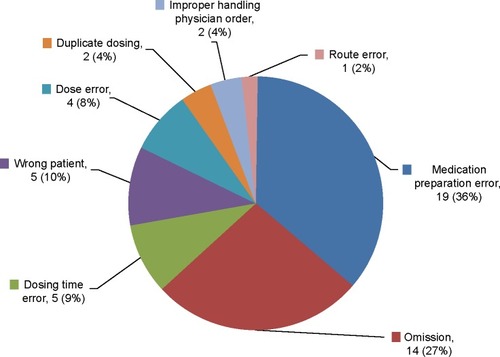
Table 3 Comparison of insulin injection technique in SAHZU program with data from other surveys
Table 4 Occurrence rates of hypoglycemia in hospitalized diabetes patients who were not from Department of Endocrinology during 2010–2013
Figure 5 Occurrence rate of hypoglycemia in diabetes inpatients in neurology wards during 2010–2013.
Notes: *P<0.01 (data during 2011–2013 versus data in 2010).
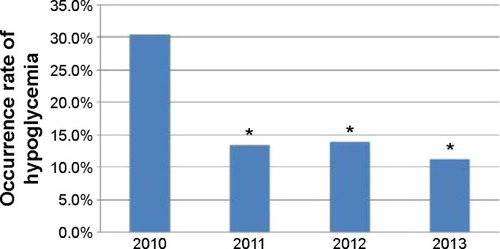
Figure 6 Quality improvement in the percentage of correctly managed hypoglycemia events in 2014.
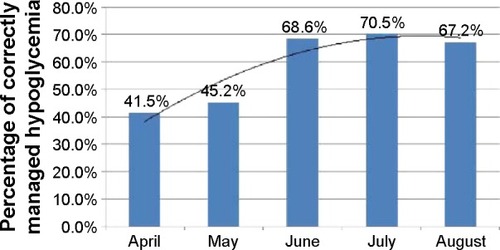
Table S1 Inappropriate medication use in diabetes patients during on-site inspection in the first and second quarter of 2014