Figures & data
Table 1 Metabolic evaluations and physical capacity in YC, YO, OC, and OO groups
Table 2 Echocardiographic measurements in YC, YO, OC, and OO groups
Table 3 Cardiac autonomic control in YC, YO, OC, and OO groups
Table 4 Inflammatory and oxidative stress evaluations in YC, YO, OC, and OO groups
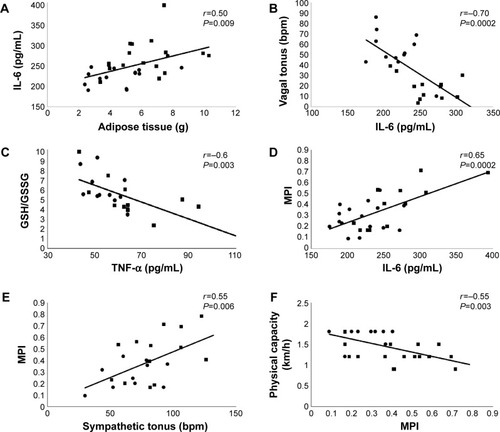
Figure 1 Pearson’s correlation analysis involving all studied groups: (•) represent YC and YO rats and (▪) represent OC and OO rats.
Notes: (A) Adipose tissue and IL-6 (r=0.5, P<0.009), (B) IL-6 and vagal tonus (r=−0.7, P<0.0002), (C) TNF-α and GSH/GSSG (r=−0.60, P<0.003), (D) IL-6 and MPI (r=0.65, P<0.0002), (E) sympathetic tonus and MPI (r=0.55, P<0.006), and (F) MPI and physical capacity (r=−0.55, P<0.003).
Abbreviations: GSH/GSSG, glutathione redox balance; IL, interleukin; MPI, myocardial performance index; OC, old (24 months old) control; OO, old ovariectomized; TNF, tumor necrosis factor; YC, young (5 months old) control; YO, young ovariectomized.
Abbreviations: GSH/GSSG, glutathione redox balance; IL, interleukin; MPI, myocardial performance index; OC, old (24 months old) control; OO, old ovariectomized; TNF, tumor necrosis factor; YC, young (5 months old) control; YO, young ovariectomized.