
Figures & data
Figure 1 Flowchart for participants in the present study.
Abbreviations: DCM, dilated cardiomyopathy; Hb, hemoglobin.
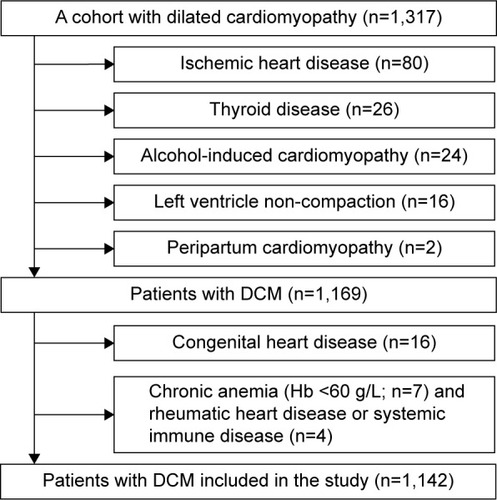
Table 1 Patient characteristics categorized by age and sex
Figure 2 Kaplan–Meier survival curves for the elderly (age ≥60 years) and non-elderly patients (age <60 years) with dilated cardiomyopathy (DCM).
Notes: (A) shows the survival curves for the elderly and non-elderly DCM patients (log-rank χ2=2.604, P=0.107). (B) shows the survival curves for the male and female patients with DCM (log-rank χ2=0.707, P=0.400).
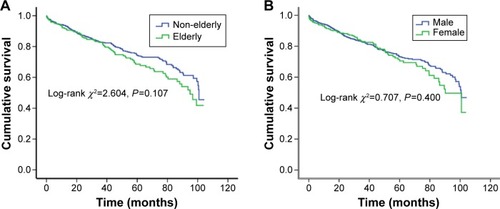
Figure 3 Kaplan–Meier survival curves for the elderly and non-elderly patients with DCM, stratified by sex ([A]: log-rank χ2=5.898, P=0.015 in male; [B]: log-rank χ2=1.062, P=0.303 in female).
Abbreviation: DCM, dilated cardiomyopathy.
![Figure 3 Kaplan–Meier survival curves for the elderly and non-elderly patients with DCM, stratified by sex ([A]: log-rank χ2=5.898, P=0.015 in male; [B]: log-rank χ2=1.062, P=0.303 in female).](/cms/asset/4ed4af53-6071-4630-8153-25712500ac7a/dcia_a_88565_f0003_c.jpg)
Figure 4 Kaplan–Meier survival curves for the male and female patients with DCM, stratified by age ([A]: log-rank χ2=3.072, P=0.080 in non-elderly; [B]: log-rank χ2=2.725, P=0.189 in elderly).
Abbreviation: DCM, dilated cardiomyopathy.
![Figure 4 Kaplan–Meier survival curves for the male and female patients with DCM, stratified by age ([A]: log-rank χ2=3.072, P=0.080 in non-elderly; [B]: log-rank χ2=2.725, P=0.189 in elderly).](/cms/asset/5f0502ca-d985-438c-8623-0fa7ae965bb2/dcia_a_88565_f0004_c.jpg)
Table 2 Cox regression of all-cause mortality in patients with DCM