
Figures & data
Table 1 Baseline demographic variables between participants who had one or more falls (fallers) and no falls (non-fallers) during the 6-month follow-up period
Figure 1 Mean (± 1 standard deviation) of the Balance Evaluation Systems Test (BESTest) total score and the sub-scores of the six domains of BESTest in fallers and non-fallers.
Notes: BESTest domains: I, biomechanical constraints; II, stability limits; III, anticipatory postural adjustments; IV, reactive postural response; V, sensory orientation; VI, stability in gait. Scores are as percentages (0%–100%) of the maximum points possible within the entire BESTest for the BESTest total score and within each domain for the BESTest sub-scores.
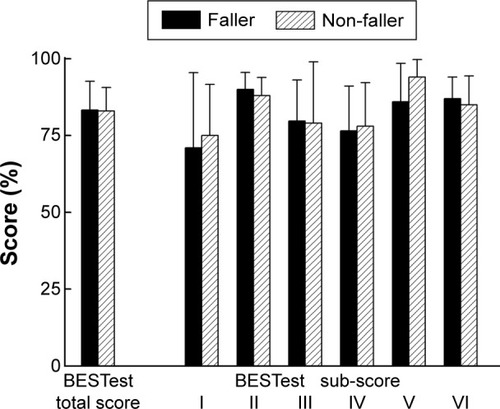
Table 2 Forward logistic regression model with the outcome of falls during the follow-up as the dependent variable