Figures & data
Table 1 Characteristics of the overall and matched cohorts; comparison between the groups treated with or not treated with PCI
Figure 1 Distribution of propensity scores in the matched and overall cohort.
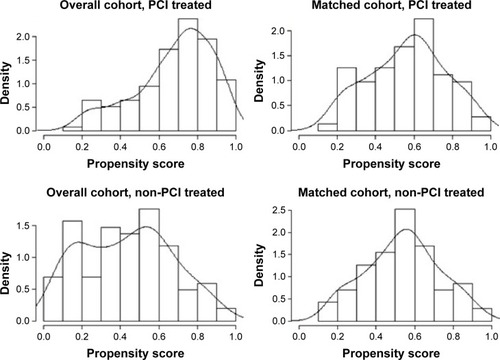
Table 2 UnivariableTable Footnote+ and multivariable Cox regression analyses for relationship between PCI and long-term all-cause mortality
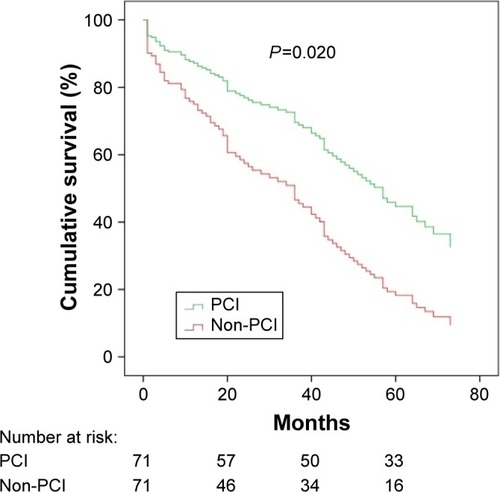
Figure 2 Kaplan–Meier survival curves for all-cause mortality of PCI-treated patients versus non-PCI-treated patients in propensity-matched cohort.
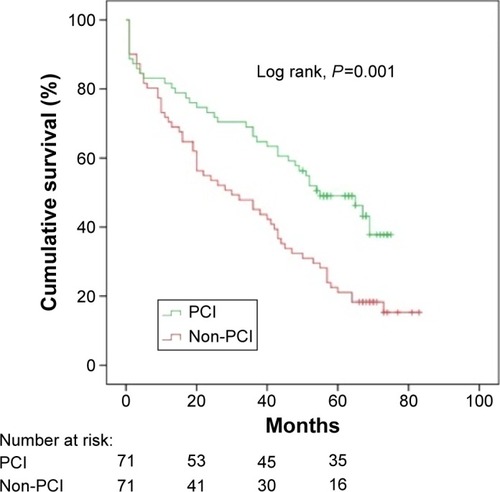
Figure 3 Cox regression survival curves for all-cause mortality of PCI-treated patients versus non-PCI-treated patients in the overall cohort (adjusted for confounders).
Abbreviation: PCI, percutaneous coronary intervention.
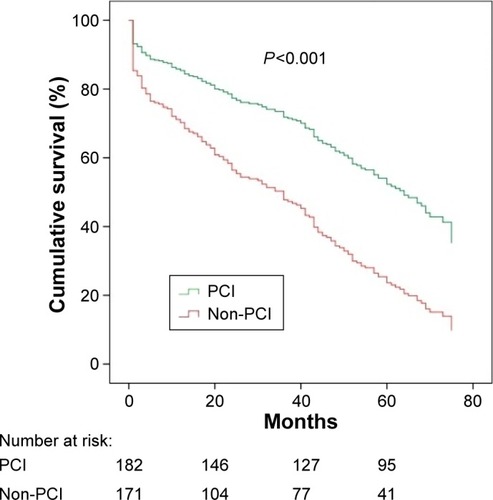
Figure 4 Cox regression survival curves for all-cause mortality of PCI-treated patients versus non-PCI-treated patients in the matched cohort (adjusted for propensity score and confounders).